Independent Australian and global macro analysis

Friday, September 4, 2020

Macro (Re)view (4/9) | Historic fall in Q2 Australian GDP

In the events of the past week, the full scale of the disruption that occurred in the Australian economy through the national shutdown was revealed. Real GDP contracted by its most on record falling by 7.0% in the June quarter (see chart of the week, below) to be down by 6.3% year on year, while hours worked across the economy were down by 9.8% in Q2 (full review here). Overall, activity in the domestic economy declined by 7.2% over the first half of the year, an extremely severe shock but relatively modest for this pandemic episode compared to what has been endured in other advanced economies (UK -22.1%, euro area -15.2% and the US -10.2%), reflecting differences in the scale of the initial virus outbreak and the severity and duration of containment measures. 

Chart of the week


The nature of the shutdown in Australia centred on the closure of non-essential services, travel bans, and restrictions on general mobility. As such, the economic contraction in the June quarter was overwhelmingly driven by household consumption, which collapsed by 12.1% (-12.7%Y/Y), accounting for 96% of the decline in the level of GDP. This came as the largest component of the economy in services-based consumption, including areas such as travel, hospitality and recreation, was the hardest hit by the restrictions falling in the order of 18%. In response to a severe dislocation in the labour market, fiscal support from the Federal Government was a key theme in the quarter, with the ABS reporting that the JobKeeper (wage subsidy) policy, enhanced social assistance payments, cash flow assistance for businesses, together with allowing the early access to superannuation accounts and loan and rent deferrals added around $67bn to household income. With the shutdown occurring and with confidence having deteriorated very sharply, the household saving ratio surged up to its highest level since the mid-1970s at 19.8% from 6.0%. This has significantly bolstered household balance sheets and will help support the economic recovery, with other areas such as business investment (-3.5% in Q2, -5.5%Y/Y) and residential construction (-6.8% in Q2, -11.2%Y/Y) likely to remain weak for some time weighed by uncertainty over the economic outlook. This underscores the importance of fiscal support ahead of the upcoming Federal Budget in October. A key aspect of the economic response to the pandemic in Australia has been the coordination between fiscal and monetary authorities and this continued this week with the RBA announcing changes to its Term Funding Facility, increasing its maximum size to around $200bn from around $152bn currently. Meanwhile, Governor Lowe in his decision statement at the conclusion of the September meeting noted the Board would "consider how further monetary measures could support the recovery" (see here).

The near-term outlook faces headwinds generated by the re-escalation of virus cases in Victoria that led to the reversal of the reopening in that state, a labour market that is still a long way from being repaired, and ongoing restrictions constraining the capacity of the economy. A range of indicators this week provided some insights into these dynamics, including the ABS Household Impacts of COVID-19 survey for August that highlighted effects on confidence not only in Victoria but also in the other states (see here). National retail sales growth in July was moderated to a 3.2% rise as spending in Victoria declined in response to the early impacts of the reinstatement of restrictions in Melbourne 
(see here), while house prices in the capital showed an outsized fall in August of 1.2% compared to the Sydney market (-0.5%) and combined capitals (-0.5%) according to CoreLogic's latest data. Also on the housing theme, the reopening of the economy appeared to be the key factor behind a 12.0% lift in dwelling approvals in July, with strength coming through from the detached (8.0%) and unit (20.1%) segments (see here). Likely also reflecting the reopening was a rebound in import spending in July (6.9%mth) as firms rebuilt inventory levels, while a decline in export earnings (-4.4%mth) on commdities weakness led to the trade surplus narrowing to its lowest level in 5 months at $4.6bn (see here).   


— — 


Moving offshore, the latest employment report in the US continued to support the narrative of improving economic conditions, even if at a moderating pace, as non-farm payrolls in August advanced by 1.371mn in a slight upside result on the consensus estimate of 1.35mn. This extended total job gains since the reopening out to 10.6mn, representing the recovery of around 48% of the jobs that were lost over March and April as the pandemic emerged. Alongside August's job gains was an uptick in workforce participation to 61.7% from 61.4% as more Americans reconnected with the labour market. Rounding out the report, the unemployment rate declined sharply from 10.2% to 8.4%, coming in well ahead of the median estimate situated at 9.8%, while spare capacity more broadly reflected in the underemployment rate fell from 16.5% to 14.2%, down from a peak of 22.8% in April. The latest readings on business activity in the US were also broadly positive this week. The ISM manufacturing index for August lifted to 56.0 from 54.2 (readings > 50 signal expansion), notching a 4th consecutive month of expansion. This was led by a 6.1% surge in the new orders component, with 15 of the 16 measured industries reporting increases in their order books over the past month. In the services sector, the ISM services index softened slightly to 56.9 from 58.1, but this still brought up a third straight month of expansion in activity. This moderation was driven by a notable slowing in new orders (-10.9%), albeit from a very elevated level (67.7) in July, though export orders rebounded by 6.5% in August. Meanwhile, following the recent shift in the Federal Reserve's policy regime to average inflation targeting, several officials from the central bank spoke publically this week. Of note, were the comments from FOMC member Lael Brainard that she anticipated policy would be set "to accommodate rather than offset inflationary pressures moderately above 2 percent, in a process of opportunistic reflation", while Vice Chair of the Fed Richard Clarida indicated that forward guidance and enhanced asset purchases remain the Committee's preferred policy tools at this stage, ahead of yield curve control and negative rates.    

Across the Atlantic, the scene is set for what will be an interesting meeting next week for the Governing Council of the European Central Bank following the recent appreciation of the single currency in both US dollar and trade-weighted terms. A  Financial Times article quoting a few ECB officials gave the impression that the exchange rate, while not yet of significant concern, has the potential to cause headaches should the appreciation be extended. Underscoring these potential concerns, the ECB's Chief Economist Philip Lane was quoted by Bloomberg saying "the euro-dollar rate does matter" as it is a factor that influences its economic outlook and policy settings. On the other hand, Governing Council member Isabel Schnabel in a Reuters report provided another perspective, outlining that the euro appreciation reflected more positive developments from the continent, such as the recent agreement of the 750bn EU recovery fund and improved global confidence that is supportive of trade and growth prospects, in turn, benefiting the outlook domestically. For the moment, the data this week emphasised that the risks are clearly on the downside. Momentum in the pace of the economic recovery slowed in August, but still pointed to an expansion of activity in the month, as the IHS Markit Composite PMI reading moderated to 51.9 from 54.9 (readings > 50 signal expansion). The key influence was a slowdown in the service sector to 50.5 from 54.7 in July, reflecting contractions in output in Italy and Spain in response to the effects of the ongoing restrictions constraining capacity and renewed virus concerns. Meanwhile, the manufacturing sector remained resilient with the pace of expansion in August effectively unchanged on the month prior. The initial rebound from the consumer coming out of the shutdown is also fading as retail sales volumes declined by 1.3% in July (0.4%yr), coming against expectations for a 1.0% rise. Of more concern, particularly at the ECB, will be the weaker-than-expected outcome from the flash estimate of the Consumer Price Index for August, which turned negative to -0.2%Y/Y from 0.4%, while core inflation weakened to its slowest pace on record at 0.4%Y/Y from 1.2%. 


Thursday, September 3, 2020

Australian retail sales rise 3.2% in July

The robust momentum in Australian retail sales coming out of the national shutdown continued into July, albeit moderated by the emerging impact of the return of virus concerns in Victoria. Retail turnover has risen by around 24% over the reopening period, reflecting a shift in spending patterns away from services into goods-related consumption. 


Retail Sales — July | By the numbers 
  • Retail turnover (nominal) advanced by 3.2% in July to $30.71bn, just below the preliminary and market estimate of 3.3%. Turnover lifted by 2.7% in June. The pace of spending in annual terms increased to 12.0% from 8.5%.


Retail Sales — July | The details

The post-shutdown period continues to see retail spending lift, rising by a further 3.2% in the month of July after gains of 16.9% in May and 2.7% in June. This followed enormous volatility over March (8.5%) and April (-17.7%) as stockpiling occurred before the shutdown. All up, turnover stands 10.6% above its pre-pandemic level from February, with this week's national accounts reporting a sharp rise in household income in Q2 due to the Federal Government's fiscal support measures, while the early access to superannuation accounts and loan and rent deferrals have also been supportive.  


Gains in turnover were broad-based across the sector in July, with support continuing in household goods as clothing and footwear extended its rebound since the reopening lifting by a further 7.1% after surging by 129.2% in May and 20.5% in June. With interstate and overseas tourism unavailable due to border closures and precautionary behaviour and social distancing ongoing, spending has shifted away from services into goods, with online retail accounting for an elevated share of total turnover at 9.7% in July.   
  

Spending in all categories except for cafes, restaurants and takeaway food, which continues to be impacted by precautionary behaviour and social distancing that places limits on capacity within premises, is now above their pre-pandemic levels from back in February. 


Under the surface of the national result is the divergence between Victoria (-2.1%m/m), as shutdown orders were reinstated in Melbourne, and the other states (5.0%m/m on a combined basis). This will only get larger in August as a more stringent and geographically wider set of restrictions were enacted across the state of Victoria, while the reopenings in the other states progressed.  


Retail Sales — July | Insights

Today's retail sales data pre-dates the full impact of the reversal of Victoria's reopening that occurred in early August. A range of indicators on the consumer, such as the latest ABS household COVID-19 survey, have reported that the events in Victoria had spillover effects on confidence in the other states. Given this and considering that Victoria accounts for around 25% of retail sales nationally, a sharp pullback is likely to come through in August.  

Australia's trade suplus narrows to $4.6bn in July

Australia's trade surplus narrowed much more sharply than forecast in July as exports came in lower on the month, while imports rebounded at their fastest pace in 2½ years, supported by the momentum generated by the reopening of the domestic economy.  

International Trade — July | By the numbers
  • Australia's trade surplus narrowed by $3.542bn in July to $4.607bn, coming in at its lowest level in 5 months and well short of the median estimate of $5.35bn. 
  • Export earnings declined by 4.4%m/m to $34.496bn, pushing out the pace of contraction in annual terms to -20.3% from -14.9%.  
  • Import spending rebounded by 6.9% in July to $29.89bn, slowing the decline in through the year terms to -15.6% from -19.3%.


International Trade — July | The details

The effects of the pandemic continue to lead to volatility in trade flows, with the $3.5bn narrowing in the trade surplus being the largest downward change in a single month on record going back to the early 1970s. Back in March, the trade surplus came in at $10.5bn, by a distance its largest in the history of the series. 

On the exports side, total earnings were driven lower falling by 4.4% (-$1.6bn) to $34.5bn, led by weakness in key commodities. Reflecting this, non-rural goods declined by 6.4% (-$1.5bn), with other mineral fuels (LNG) -18% (-$0.63bn), iron ore -4% (-$0.46bn) and coal, coke and briquettes -10% (-$0.32bn). Rural goods fell by 15.1% as weakness came through in cereals and meat. Earnings from services exports recorded their sharpest fall since the emergence of the pandemic contracting by 12.1% (-$0.77bn), possibly pointing to the departure of some overseas students that had remained in Australia over recent months. Some mitigation of these declines came from non-monetary gold, which lifted by $1.25bn in the month. 


The 6.9% rise in imports was its strongest in a single month in 2½ years, coming in at $29.9bn, though this still leaves the level down by around 5% pre-pandemic in March and nearly 16% lower than a year ago. July's rebound mainly reflected strong gains across capital goods 18.1% ($1.0bn) and consumption goods 7.4% ($0.61bn), with the latter boosted by shipments of new vehicles that advanced by 90% in the month to $1.3bn. Services imports were little changed at around $3.7bn and continue to be held down by the overseas travel restrictions.   

  
International Trade — July | Insights

A sharp fall in exports and a strong rise in imports led to a sizeable narrowing of the trade surplus in July. Weakness in resource shipments largely explains the decline in exports, while the strength on the import side came in response to the reopening of the national economy, with firms restoring inventories that had been run down through the shutdown as reported in this week's national accounts for Q2

Wednesday, September 2, 2020

In review: Australian Q2 GDP: Economy shuts down as pandemic hits

The Australian economy contracted by a historic 7.0% in the June quarter, slightly weaker than the consensus estimate (-6.0%), reflecting the full scale of the disruption to activity through the national shutdown between late March to Mid-May prompted by the escalation of the COVID-19 pandemic. Annual real GDP growth fell from 1.6% to -6.3%.


After the 0.3% decline reported in the March quarter, the level of Australian GDP has fallen to its lowest since Q3 2016.


Over the first half of 2020, activity in the Australian economy contracted by 7.2%. By comparison, this is at the modest end of the scale to what has been endured in other economies, though there have been significant differences in the severity and duration of containment measures and in the subsequent pace of reopening from country to country. 


Rising virus cases led to the effective shutdown of the national economy from late March, with the Federal Government mandating the closure of non-essential services, announcing social distancing guidelines, while earlier restrictions placed on travel were broadened and tightened. 


The impact of the shutdown was at its most severe through April, as economic activity and general mobility fell very sharply in the nation's capital cities. As a result, the labour market sustained its most severe dislocation in many decades, with total job losses of around 870k occurring between April and May, mostly in the part-time segment and in the industries most affected by the restrictions. The unemployment rate has elevated from 5.2% pre-pandemic to its highest level in 20 years at 7.5% by July, while these national accounts reported that hours worked across the economy contracted by 9.8% in Q2.     


Through this period, an unprecedented level of fiscal support was provided to the economy, with the Federal Government announcing direct measures of more than $160bn out to 2023/24 (equivalent to around 8% of GDP), centred on the key JobKeeper (wage subsidy) policy that has limited the damage to the labour market, increased social assistance payments and cash flow support for businesses. The Reserve Bank of Australia has supported financial conditions by purchasing around $61bn of Australian Government Securities since late March and its Term Funding Facility has led to $52bn in cheap 3-year liquidity flowing into the banking sector, while at the August policy meeting the Board pledged to consider "how further monetary measures could support the recovery".        

After the containment measures were able to slow the infection rate, the National Cabinet announced a three-stage plan for reopening, which started to be enacted across most states from mid-May. A strong rebound in activity ensued, with around 39% of the earlier job losses recovered through the initial phase of the reopening. However, the recovery started to lose momentum in mid-June as virus concerns returned in Victoria, leading to an eventual reversal of its reopening, and this had spillover effects on confidence across the other states. 

The outlook for the Australian economy is considerably uncertain and is to a large extent dependent on the path of the virus. As this episode has shown, consumer and business confidence is vulnerable to sudden and severe pullbacks if health concerns begin to rise. The recovery also faces headwinds from the legacies of the pandemic through the damage to the labour market and from ongoing restrictions that will restraint the capacity of the economy to operate at its previous level. In response, significant monetary and fiscal support will continue for some time, led by the latter. Federal Treasury estimates that government payments as a share of GDP will rise to around 34% by the end of the current financial year, well up from the long-run average of around 25%. This is key as it will be the consumer that will need to drive this recovery as uncertainty weighs of other areas of the economy such as business investment and residential construction. The positive is that household balance sheets have been strengthened by the fiscal support measures and this should help to underpin the recovery, together with successful containment of the virus.  


— — 

GDP — Q2 | Expenditure: GDP (E) -6.8%q/q, -6.0%Y/Y

Household consumption (-12.1%q/q, -12.7%Y/Y) — Australia's historically large economic contraction of 7.0% in the June quarter centres on the household sector. The 12.1% collapse in household consumption accounts for 96% of the decline in economic output in Q2. This was a severely disruptive and unsettling period for domestic households with confidence collapsing to record low levels, while the labour market was upended as firms responded to the shutdown by standing staff down or cutting back hours. 


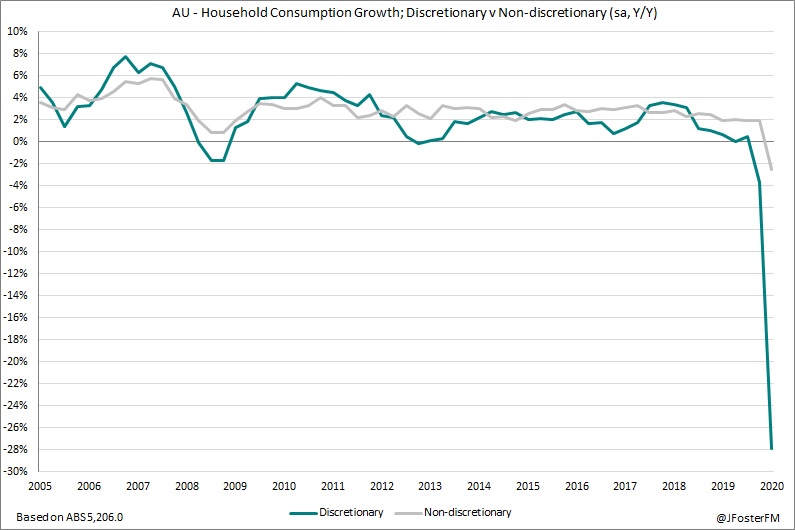
Given the nature of the shutdown, the pattern of household consumption shifted very significantly and very rapidly. With large sections of the services sector shuttered and border closures grounding tourism, discretionary consumption collapsed. Very steep declines came through in the areas that were most impacted by the restrictions, such as transport services (includes travel) (-85.9%), hotels, cafes and restaurants (-56.1%), other services (such as personal categories) (-31.2%) and recreation and culture (-15.3%). Meanwhile, reduced mobility led to fuel consumption contracting by 25.5%. Areas of consumption that were well supported through the shutdown were in alcohol (13.0%) as licensed premises were closed and in household goods (9.5%) for entertainment purposes and to facilitate working from home arrangments.


The story around household incomes is very much linked to the Federal Government's fiscal support measures. The JobKeeper policy, enhanced unemployment support payments and cash flow assistance to businesses are estimated by the ABS to have added $48.0bn to household income over Q2, while the Bureau noted there was an additional $19.6bn not reflected in the national accounts through the early access to superannuation accounts and loan and rent deferrals. As a result of these measures, despite the dislocation that occurred in the labour market, real household income lifted by 3.0% in Q2 to its strongest pace in 9 years at 5.9%yr. However, with the shutdown restricting activity and with confidence having deteriorated, the household saving ratio soared from 6.0% to 19.8% — its highest since the mid-1970s. While the road to recovery is likely to be long and uncertain, the silver lining is that household balance sheets are now in strong shape and this will help support the nation through these troubling times, even as fiscal measures are eventually tapered.  


Dwelling investment (-6.8%q/q, -11.2%Y/Y) — Residential construction has been in a downturn since the second half of 2018 and the 6.8% contraction that came through in Q2 was the weakest outturn over this period. New home building declined by 7.3% — its sharpest fall in 20 years — while alteration work pulled back by 6.0%. The impact of ongoing restrictions on migration and uncertainty around population growth dynamics is likely to lead to a more protracted recovery in the sector. Meanwhile, ownership transfer costs, which relate to fees associated with real estate transactions, collapsed by 18.6% in the quarter as turnover in the residential property market fell sharply in response to social distancing measures that prohibited open house inspections and public auctions.  

  
Business investment (-3.5%q/q, -5.5%Y/Y) — The onset of the pandemic leading into the shutdown understandably saw business confidence collapse, as firms focused on preserving liquidity to make it through to the other side of the crisis. In response, business investment declined sharply across equipment and machinery (-6.8%) and intellectual property products (-6.0%), accelerating weakness already established ahead of the pandemic. The recent ABS Capital Expenditure survey pointed to a further declines in forward-looking investment plans, most notably in the services industries, given the highly uncertain economic outlook. 


Public demand (2.1%q/q, 6.3%Y/Y) — Robust public demand growth remains a key support for the domestic economy at a time of intense weakness in the private sector. Public spending lifted by a further 2.9% in Q2 (7.5%yr) as the health response to the pandemic ramped up. While investment has slowed of late falling by 1.6% in Q2 (1.1%yr), governments in Australia have indicated that infrastructure spending will be fast-tracked to support the economic recovery.


Net exports (1.0ppt in Q2, 1.6ppts yr) — Both exports and imports were severely impacted by pandemic restrictions, most notably those curtailing travel to and from Australia. Exports contracted by 6.7% in Q2, though a much larger fall was recorded by imports of 12.9% in which consumption of services collapsed by 50.5% as overseas travel was brought to a halt (-98.7%) by the international border closure, while capital goods (-2.5%) also weakened as business investment continued to deteriorate.     


Inventories (-0.6ppt in Q2, -0.6ppts yr) — The disruption to operating conditions and weak demand conditions through the shutdown resulted in firms not needing to build up stock levels, with sharp declines in retail and wholesale inventories coming through. 

— — 

GDP — Q2 | Incomes: GDP (I) -7.2%q/q, -6.4%Y/Y

The real GDP estimate of income posted a 7.2% fall in the June quarter as the annual pace plunged to -6.4% from 1.5%. 


In nominal terms, Australian GDP contracted by 7.6% in Q2 — by a distance the largest quarterly income shock on record — to be down by 5.9% through the year as the shutdown hit business and employee incomes hard. However, this was mitigated by the transfer of subsidies from the Federal Government to the private sector. 


The terms of trade were a negligible impact in the quarter, lifting by just 0.2% as the annual pace decelerated from -0.6% to -1.8% on a base effect.  


Private sector company profits (ex-financial corporations) surged up by 14.9%in Q2 and by 16.3% over the year, with the key factors being the impact of the JobKeeper (wage subsidy scheme) and the 'Boosting cash flow for employers' (refund of tax withheld) policies. Small businesses were a key beneficiary of these policies with gross mixed income accelerating by 21.9% in Q2 to drive annual growth out of a 5-quarter long stretch in contraction to 19.6%. Financial corporations' profits weakened in Q2 falling by 0.5% (2.5%yr), with interest margins likely being squeezed by lower rates, while economic uncertainty weighed on credit demand in recent months.  


Wages and salaries based on the compensation of employees measure declined by its most on record falling by 2.5% in the June quarter to cut 4ppts off the annual pace to 0.3%. However, the 2.5% contraction needs to be assessed against a fall of 9.8% in hours worked across the economy in Q2. Were it not for the JobKeeper policy, wages income would have fallen much more precipitously.  


— — 

GDP — Q2 | Production: GDP (P) -7.1%q/q, -6.4%Y/Y

The June quarter production estimate contracted by 7.1%, with the annual pace falling to -6.4% from 1.5%. The impact of the shutdown was most severe on those operating in non-essential services, which were mandated by the Federal Government to close on March 22 or trade at a very restricted capacity, and also those in the travel and tourism industry in response to domestic and international border closures. As such, very large contractions came through from accommodation and food services (including licensed venues and hotels) -39.0%, arts and recreation (including sporting, gambling and performing arts activities) -22.6%, transport, postal and warehousing (including domestic and international travel) -21.5% and 'other' services' (such as hairdressers etc) -18.5%. Meanwhile, real estate services contracted by 15.9% due to the effective closure of the residential property market during the shutdown as open house inspection and public auctions were prohibited under social distancing guidelines. 

Also of note, though construction was designated as an essential service enabling work to continue around social distancing guidelines, output still fell very sharply in Q2 (-8.2%), while the health care industry (-7.9%) was impacted by fewer face to face appointments and by reduced demand for hospital services. The full industry breakdown is outlined in the summary table, below.


— — 

GDP — Q2 | Prices

The pandemic has been a disinflationary shock to the economy. As measured by the GDP deflator, economy-wide inflation f
ell by 0.6% in Q2, slowing the annual pace from 1.7% to a 4-year low of 0.4%. The impact from the terms of trade was broadly neutral in the quarter. Adjusting for the terms of trade outcome, the gross national expenditure deflator reported a 0.7% decline in price levels in the June quarter to reduce the pace of growth through the year to 0.9% from 2.0%.


The closest proxy in the national accounts to the Consumer Price Index (CPI) is the household consumption deflator but it differs in that it accounts for dynamic shifts in spending patterns nationwide rather than the fixed basket capital city-based methodology in the CPI. The household consumption deflator declined by 0.8% in Q2 — its largest quarterly fall in more than half a century — reflecting a very sharp fall in petrol prices and a range of other cost-saving measures announced by governments and by the private sector, such as private health insurers delaying premium increases. As a result, the annual pace dropped down to 0.5% from 1.9%. By comparison, the CPI (seasonally adjusted) contracted by a much larger 2.0% in Q2 to be down by 0.5% through the year, with the ABS explaining that this was due to a different treatment within the national accounts around the Federal Government's policy decision to make child care service free during the shutdown.   

— — 

GDP — Q2 | Productivity

The disruption caused by the shutdown and ongoing restrictions on activity led to hours worked across the domestic economy collapsing by 9.8% in the June quarter (-10.0%yr), coming after a 0.9% fall in Q1 (-0.4%yr) as the pandemic emerged in late March. Over the first half of 2020, hours worked fell by 10.6%. The disruptions were even more severe in the market sector (excludes government sector), with hours worked plunging by 12.2% (-13.3%yr) and by -13.5% over the first half. 


As the decline in total hours worked (-9.8%) was larger than the decline in economic output (-7.0%), that mechanically led to a strong rise in GDP per hour worked (+3.2ppts to 4.2%Y/Y). GDP per capita fell by 7.2% in Q2 to be down by 7.4% over the year. Given the severity of the economic shock and the very significant shifts that have occurred in terms of how businesses operate, it is clearly not a time to be making judgments around productivity. 


— — 

GDP — Q2 | States

State demand was down very sharply across the nation in the June quarter, though divergence will come through in Q3 to reflect the subsequent reversal of Victoria's reopening as the other states progressed their recoveries. 


Unsurprisingly, the contractions in Q2 were most severe in the two most populous states of New South Wales (-8.6%) and Victoria (-8.5%), reflecting the hit to household spending (-13.3% in NSW, -13.7% in VIC). Both states also recorded accelerated weakness in business investment as economic uncertainty weighed. 


Household consumption also led the way down across the other states and declined by similar magnitudes in Queensland (-9.6%), South Australia (-9.9%) but was more severe in Western Australia (-10.6%) and Tasmania (-12.5%). 


Tuesday, September 1, 2020

Australian Q2 GDP -7.0%; -6.3%yr

The shutdown of the Australian economy between late March to mid-May to contain the spread of the COVID-19 pandemic resulted in GDP contracting by a sharper-than-expected 7.0% in Q2 (median estimate was -6.0%) following on from a 0.3% decline in Q1. Over the period, activity contracted by 7.2%, an extremely severe shock but at the modest end of the scale in a global context. In annual terms, GDP growth rolled over from 1.6% to -6.3%, while in level terms, GDP fell back to where it was in Q3 2016.  


The closure of non-essential services and the effects of social distancing restrictions towards the end of March resulted in economic activity and mobility being greatly reduced. This was most pronounced in April to mid-May, before the restrictions started to be gradually eased after the virus infection rate was slowed, with the National Cabinet agreeing to a three-stage reopening plan. A robust rebound ensued through to mid June when it started to lose momentum as virus concerns returned in Victoria and this had spillover effects on confidence in the other states. 


The labour market endured a very significant dislocation in the quarter, with total job losses of around 870k, the unemployment rate surging to its highest levels in more than 20 years and hours worked across the economy falling by 9.8% in the quarter. Fiscal support from the Federal Government, centred on direct income measures, has been unprecedented and has helped to mitigate the full impact of the labour market dislocation. Meanwhile, the RBA's Term Funding Facility has provided the banking sector with $52bn in cheap 3-year liquidity since its inception in late March, while it has also purchased $61.3bn of Australian Government Securities in support of its 0.25% 3-year yield target and to help the bond markets function effectively amid a tide of new issuance from the AOFM.  

To the details of today's national accounts, household consumption plunged by 12.1% in the June quarter, with the ABS noting the consumption of services collapsed by 17.6% as the restrictions hit areas including travel and eating out. In real terms, household income surged up by 3.0% in response to the impact of the Federal Government's income supports, but with few places to go and with confidence having been weakened severely, most of this will be kept for another day as the household saving ratio soared from 6.0% to 19.8%. 


Across the other components, residential construction activity saw accelerated weakness contracting by 6.8% in Q2 and faces an uncertain outlook with restrictions on movement in and out of Australia set to persist for a while yet. Unsurprisingly, weakness in business investment also became more pronounced (-3.5%) as firms focused on preserving liquidity to make it through to the other side of the crisis, while the uncertain economic climate has led to investment plans being cut back. Imports (-12.9%q/q) were more severely impacted through the initial phase of the pandemic than exports (-6.7%q/q), with the latter receiving support from resources shipments and overseas students that remained in the country. Public demand also lifted in Q2, focuesd on spending (2.9%q/q) as investment declined (-1.6%q/q).   

Link to our full review here

Australian dwelling approvals rebound in July

Australian dwelling approvals came in much stronger than expected in July posting a 12% rebound to end a run of 4 consecutive monthly declines since the onset of the pandemic. The ABS attributed the result to improved sentiment through the initial phase of the reopening of the national economy from mid-May.   

Building Approvals — July | By the numbers
  • Dwelling approvals (seasonally adjusted, including the private and public sectors) lifted off their lowest level in 8 years advancing by 12.0% in July to 13,840. The median estimate was for a 2.0% decline following on from the 4.9% fall in June.   
  • Growth in approvals through the year turned positive to 6.3% from -14.8%.
  • Unit approvals led the way rising by 20.1% in the month to 4,888, with the annual pace swinging from -29.1% to 8.4%. 
  • House approvals surged up by 8.0% in July for their strongest monthly rise in 6½ years to 8,952, lifting annual growth to 5.3% from -5.4%. 


Building Approvals — July | The details 

After the onset of the pandemic accentuated a well-established period of weakness, dwelling approvals rebounded by 12.0% in July, helped by improved sentiment as the economy started to reopen and possibly with some support from the announcement effect of the Federal Government's HomeBuilder scheme. Notwithstanding this, the upside result in July followed a 21% contraction in approvals through the first half of the year. Both the headline and underlying detail pointed to broad-based support across houses and unit categories in July. 


The value of alteration work approved to existing residential properties weakened by 1.1% in July to $0.715bn to be down by 1.3% over the year but this is well up from the lows through the shutdown. Meanwhile, non-residential approvals largely retracted a sharp rebound in June to fall by 19.8% this month to $3.3bn, which is vastly weaker than the level from a year earlier (-15.7%yr).

  
Details across the states were mixed as rebounds came through in New South Wales (+32.0%), Victoria (+9.3%), Queensland (+7.7%) and Tasmania (+50.0%) as weakness persisted in South Australia (-10.5%) and Western Australia (-8.3%).  

Building Approvals — July | Insights 

Dwelling approvals appear to be another that can be added to the list of indicators that have shown a sharp rebound coming out of the national shutdown. There remains considerable uncertainty around the outlook for the residential construction sector amid weak economic conditions and the impact of border restrictions limiting population growth. On the positive side will be the support from the Federal Government's HomeBuilder scheme that offers to provide qualifying owner-occupiers with grants of $25k to build a new home or substantially renovate an existing home.  

RBA announces TFF expansion

The Reserve Bank of Australia Board maintained its 0.25% targets for the cash rate and 3-year Commonwealth Government bond yield at today's September policy meeting, though Governor Philip Lowe in his decision statement announced an expansion to its Term Funding Facility (TFF).


The changes made to the TFF (see here) include a new 'supplementary funding allowance' to become available to the banking system when the window for accessing their initial allowances ($84bn in total) closes at the end of September. This has been assessed by the RBA to open up an additional $57bn in 3-year liquidity fixed at 0.25% between 1 October and 30 June 2021. As a result, the maximum size of the TFF will advance from around $150bn to around $200bn. The other change was a 3-month extension of the deadline banks will have for accessing their additional allowances (currently around $70bn in total) from March to June 2021.

There were several other points of interest in today's statement. Overall, the tone clearly slanted towards a more accommodative stance going forward, with the governor noting the Board will continue to "consider how further monetary measures could support the recovery". After the restart of the RBA's bond-buying activity was commenced following the August meeting, an additional $10bn of Australian Government bonds were bought (total of $61bn) with the governor pledging that "further purchases will be undertaken as necessary". The prospect for more policy support comes amid strengthening in the Australian dollar that was assessed as being "around its highest level in nearly two years". Meanwhile, Governor Lowe noted the ongoing importance of the role of fiscal policy and with public sector balance sheets being "in good shape" he outlined that there was scope for more support to be forthcoming. 

Comments on the economy reiterated the RBA's outlook from the recent Statement on Monetary Policy in pointing to a more uncertain and less robust economic recovery through 2021, but from a slightly better starting point with the impact of the initial national shutdown to contain the pandemic assessed as being less severe than previously expected.