Independent Australian and global macro analysis

Friday, September 29, 2023

Macro (Re)view (29/9) | Q3 headwinds set to persist

A tough Q3 came to a close this week, a quarter in which a significant shift higher in long-end US yields weighed heavily on equity valuations and was a tailwind to the US dollar. The outlook for a more extended period of an elevated Fed policy rate is a theme that is resonating with central banks in other countries with inflation still well above their respective targets.


Despite an uptick in Australian headline inflation, the RBA is likely to leave the cash rate (4.1%) unchanged for the fourth meeting in succession next week. A 9.1% surge in petrol prices saw the 12-month CPI rate rise to 5.2% in August from 4.9% in July (reviewed here). Excluding petrol and other volatile items, underlying inflation softened slightly from 5.6% to 5.3%. Compared to their late 2022 peaks above 8%, inflation has declined materially year to date - a key factor that has kept the Board from hiking further at recent meetings. With retail sales posting an underwhelming 0.2% rise amid the FIFA Women's World Cup (reviewed here) and job vacancies (-9.1%q/q) continuing to moderate from their post-pandemic highs, there were more signs this week that higher interest rates are contributing to cooling demand. 
  

Encouraging US inflation data has weakened the case for the Fed to hike rates further at its November meeting. The core PCE deflator - a key inflation gauge for the Fed - slowed from 4.3% to 3.9%yr in August, a low back to June 2021. More importantly, the recent momentum in both 3-month (2.2%) and 6-month (3%) annualised terms suggests a more rapid pace of decline is in prospect, leaving the Fed's forecast for a 3.7% core PCE inflation rate at year-end looking overdone. Meanwhile, historical revisions to GDP data have upgraded the strength of the recovery in the US from the pandemic. Momentum in the US has been solid through the first half of the year - 0.6% in Q1 and 0.5% in Q2 - with GDP expanding by 1.1% over the period. 


After only inching lower in recent months, euro area inflation fell materially in September. Headline inflation declined from 5.2% to 4.3%yr - a near 2-year low - and the core rate came down from 5.3% to 4.5%yr, with both outcomes exceeding the declines expected (4.5% and 4.8% respectively). Although higher oil prices pose a risk of disrupting this downward momentum, a strong disinflationary impulse is coming from the weakness in the euro area economy. This only validates the sentiment coming out of the ECB's meeting two weeks ago that rates have reached their peak. 


Wednesday, September 27, 2023

Australian retail sales slow in August

Australian retail sales lifted by 0.2% in August, disappointing expectations (0.3%) and slowing from a 0.5% rise in July. Discretionary-related sales at 0.5% month-on-month outperformed the headline result, boosted by the FIFA Women's World Cup and Afterpay sales promotions. Annual growth in retail sales has eased back to 1.5%, underpinned by rapid post-pandemic population growth of above 2% according to the various estimates. 


Soft trends in retail sales continued in August, with turnover slowing to a 0.2% rise and flatlining on a 3-month average basis. Cost-of-living pressures and higher interest rates are constraining spending, as the June quarter national accounts confirmed recently. That said, discretionary sales have posted gains of 0.9% in July and 0.5% in August. This has been supported by the Women's World Cup and it will be interesting to see if the domestic football finals can have a similar effect on September sales. Beyond that, discretionary spending could cool in October as households wait for Black Friday sales to come around in November. 


Looking across the board, the main weakness was in basic food (-0.3%) after a modest decline in the prior month (-0.1%). Household goods contracted a further 0.4% to be down 6.6% over the year, reflecting the post-pandemic rotation in spending to services. 

The boost from the Women's World Cup came through in clothing and footwear (1.3%) - on the back of spending on supporter gear - and cafes, restaurants and takeaway food (0.7%) - as Australians watched the tournament at venues, live sites and private gatherings. The 'other' retailing category (of which pharmaceuticals are a large component) lifted 0.7%m/m and department stores saw a 0.4%m/m rise, moderating from a rebound in July (3.6%). 

Australian CPI increases to 5.2% in August

Australian CPI inflation lifted off a 17-month low increasing to 5.2% in August from 4.9% in July, largely reflecting a spike in petrol prices. While this comes as an untimely elevation going into next week's RBA meeting, the underlying inflation gauges were flat to slightly softer in August.  


Petrol prices recorded their fastest monthly rise (9.1%) since May 2022, pushing up the 12-month headline inflation rate from 4.9% to 5.2%. Nonetheless, the bigger picture is that inflation is well down from the 8.4% peak at the end of last year, and that disinflationary process continued to play out in the September quarter. The past two monthly reports indicate that inflation is on track to come in a little above 5% (year-ended) in the detailed quarterly series in Q3, down from 6% in the June quarter.  


On an underlying basis, inflation held at 5.6% on the trimmed mean measure while it eased from 5.6% to 5.3% for CPI excluding volatile items (petrol, fruit and vegetables). These latest readings compare to their respective late 2022 peaks of 7.2% and 8.3%. 


Mainly due to the effect of higher petrol prices, goods inflation lifted from 4.4% to 5.1%yr. Services inflation remains more elevated but held at a 5.6%yr pace. Factors contributing to the faster pace of services inflation include rents (7.8%yr) and holiday travel and accommodation (6.6%yr). 

Friday, September 22, 2023

Macro (Re)view (22/9) | Higher for longer

Hawkish holds from the Fed and BoE were the highlights from a flurry of central bank meetings this week as the BoJ and SNB also left monetary policy unchanged. The key message from the Fed that restrictive policy will likely be required for longer in order to return inflation to target sent the US 10-year Treasury yield to highs back to 2007, a major headwind for risk assets. The latest PMI readings underscored the growth differential that exists between a resilient US economy and weakness in Europe and the UK. 


The Fed's decision to leave rates on hold in the 5.25-5.5% range this week was qualified by the signal that restrictive settings will be needed for longer, reflecting an outlook for stronger US growth. Updated economic projections showed FOMC members continue to see a final rate hike to a peak of 5.5-5.75% later this year remains in prospect, but the number of rate cuts implied by the 2024 projection has fallen to 2 (5-5.25%) from the 4 (4.5-4.75%) signalled previously. This revision has flowed through to drive the 2025 projection 50bps higher to the 3.75-4% range. 

In the post-meeting press conference, FOMC Chair Jerome Powell said recent data had prompted Committee members to upgrade their outlook for US growth. Forecast growth this year was raised materially to 2.1% from 1%, with stronger growth now also seen in 2024 at 1.5% (from 1.1%) while the 2025 forecast remained at 1.8%. On the back of this, the unemployment rate outlook has improved, ending the year at 3.8% (from 4.1%) before lifting only modestly to 4.1% in 2024 (from 4.5%) and remaining at that level through 2025 (from 4.5%). Thus while the outlook is for stronger growth and lower unemployment - despite tighter policy - the inflation forecasts were little changed, expected to still be firm to the 2% target on headline (2.2%) and core rates (2.3%) in 2025. 

Declining UK inflation paved the way for the Bank of England to hold rates steady at 5.25% at this week's meeting. In a very close call, a 5-4 majority of MPC members gave the green light to pause the hiking cycle, coming after a cumulative 515bps of policy tightening stretching back to December 2021. Meanwhile, the MPC set a new target of £100bn for balance sheet reduction over the coming year, an increase from £80bn over the past 12 months. 

Headline CPI eased from 6.8% to 6.7%yr in August; however, it was the fall in the core rate from 6.9% to 6.2% - backed up by softer services inflation (7.4% to 6.8%) - that was likely the decisive factor with the majority on the MPC. Also key was the observation that rates had already been increased to a restrictive setting and the full effects of this on the economy had yet to play out. This portends an extended pause from the BoE. Although further tightening has not been ruled out, the statement noted the approach will be to ensure that rates are "sufficiently restrictive for sufficiently long to return inflation to the 2% target...". 

More context around the RBA's tightening pause was provided in the September meeting minutes. Signs that tighter policy is weighing on demand and the lags of monetary policy were still to come are key factors keeping the Board on hold. Although the Board retains a tightening bias it is unlikely to be enacted. The Board assesses that the recent data flow "was consistent with inflation returning to target within a reasonable timeframe while the cash rate remained at its present level". 

Friday, September 15, 2023

Macro (Re)view (15/9) | ECB reaches peak

Signs the ECB's tightening cycle has peaked amid ongoing resilience in the US economy left the US dollar to continue its upward momentum. Improved activity data from China provided some support for the Australian dollar as did a rebound in the August labour force survey. Next week's calendar is highlighted by central bank meetings in the US, UK and Japan.  


August's US inflation data did little to shift the dial ahead of next week's Federal Reserve meeting. The FOMC is expected to leave rates unchanged at 5.25-5.5%, but markets are keeping alive prospects for a November hike on the basis that Fed officials may reaffirm their projection from June for a 5.5-5.75% terminal rate. Headline CPI lifted from 3.2% to 3.7%yr, largely due to a 10.6% surge in gasoline prices in August; however, a decline in the core rate from 4.7% to 4.3%yr suggests the underlying disinflationary process in the US continues to play out. Higher gasoline prices also boosted August retail sales to a 0.6% month-on-month rise, an upside surprise. But there were continued signs of resilience in the report as core sales (ex autos & gas) (0.2%m/m) and control group sales (0.1%m/m) defied expectations for declines. 


In what was a closely contested decision, the ECB hiked all key rates by 25bps (MRO 4.5%, MLF 4.75% and depo rate 4%) this week. But that was counterbalanced by strong indications that the tightening cycle has reached its peak. Faced with elevated inflation and an economy that has deteriorated to the point of stagnating, the hawkish section of the Governing Council got another hike across the line on the basis that it needed to "reinforce progress" towards its single mandate for 2% inflation. Further tightening looks unlikely. The Governing Council assesses that rates are now at levels that - if maintained for a "sufficiently long duration" - will "make a substantial contribution" in returning inflation to its 2% target.    

In the post-meeting press conference, ECB President Christine Lagarde would not be drawn on declaring a peak for rates, stressing the need to remain data dependent. That came as updated ECB staff projections raised the inflation outlook at the same time as lowering forecasts for growth. Due to higher energy prices, inflation is now seen at 5.6% this year (from 5.4%) and 3.2% in 2024 (from 3.0%). As with the June forecasts, inflation is still expected to be firm to the target in 2025 at 2.1% on a headline basis (from 2.2%) and 2.2% on the core rate (from 2.3%). Higher rates, weakening exports and fading momentum in the services sector have all contributed to lower forecast growth at 0.7% in 2023 (from 0.9%) and 1% in 2024 (from 1.5%). 

Australian employment rebounded by 64.9k in August - well above the top end of forecasts - confirming seasonal-related volatility played a major role in July's surprise decline (-1.4k revised from -14.6k). With employment regaining momentum, the unemployment rate held at 3.7% as the labour force participation rate lifted to a new record high at 67.0% (from 66.9%). My assessment is that rapid population growth is supporting both labour demand and labour supply, giving reason to remain optimistic on the outlook for the labour market (more insights here). 

Wednesday, September 13, 2023

Australian employment 64.9k in August; unemployment rate 3.7%

Australian employment rebounded well above expectations in August, but the unemployment rate held at 3.7%. The overlay of rapid post-pandemic population growth continues to support labour demand and add to labour supply, with the participation rate rising to a new record high in the month.

August by the numbers...
  • Employment increased by 64.9k (on net), rebounding from a 1.4k fall in July (revised from -14.6k initially reported). Consensus was for a 25k rise.   
  • The headline unemployment rate remained at 3.7% (vs 3.6% expected). Both underemployment (6.6% from 6.4%) and underutilisation (10.2% from 10.1%) increased in August.   
  • Australia's labour force participation rate reset to a new record high at 67.0%, up from 66.9% previously (revised from 66.8%). 
  • Hours worked declined 0.5%m/m, with base effects lowering the annual pace from 5.2% to 3.7%. 


The details...

Employment rebounded strongly by 64.9k in August, confirmining that July's decline (-1.4k) was driven by post-pandemic volatility in hiring patterns. Part-time employment accounted for much of the rise lifting by 62.1k - its strongest outturn since November 2021. Full time employment saw a 2.2k rise following a decline of 18.7k in July. 


As a result of upward revisions and the August rebound, the momentum in employment growth remains solid. Employment gains have averaged 30.3k over the past 3 months, running an at annualised pace of 2.6% over the period. 


Although employment far exceeded consensus, the unemployment rate held at 3.7% - disappointing expectations for a decline to 3.6%. However, that forecast was based on a participation rate 0.3ppt lower than the record high that printed in August at 67%. Modest rises in underemployment and total underutilisation over recent months are consistent with some loosening in the labour market, but conditions remain robust overall. Best summarising conditions, the employment to population ratio - the share of Australians in work - remains on the highs for the cycle at 64.5%. 


Hours worked were reported to have declined by 0.5% in the month, to me a surprising outcome given the strength of employment. Although some may argue this links to the softness in full time employment (2.2k), consider that hours worked actually rose in July (0.2%) when full time work declined by 18.7k. This all looks to be reflecting month-to-month volatility rather than giving any signal. 


In summary...

Today's report reflected a solid analysis of the labour market all told. The most important aspect was that employment came through with the expected rebound after falling in July, a decline that was very modest after revisions. The unemployment rate holding at 3.7% and a softening in broader measures of spare capacity should be enough to extend the RBA's pause further. While expectations are that the unemployment rate will drift higher over the next couple of years, I am more optimistic than the trajectory forecast by the RBA to 4.5% unemployment. Momentum in employment is running at a sustainable pace and I think strong population growth is a factor that will keep labour demand supported.   

Preview: Labour Force Survey — August

Australia's Labour Force Survey for August is due at 11:30am (AEST) today. Coming off a weak month in July, employment is expected to return to its earlier momentum with a 25k rebound. The unemployment rate is seen falling back to 3.6%, just above 50-year lows with labour force participation holding near record highs. 

Labour market activity was surprisingly weak in July...

The labour market hit turbulence in July as employment unexpectedly fell by 14.6k (vs +15k forecast), driving up the unemployment rate from 3.5% to 3.7%. This was the weakest employment outcome since the 2021 pandemic lockdowns - coming against the run of play from the strength in employment in the June quarter (103.2k).  


... likely due to seasonal factors

In addition to the uptick in unemployment, the participation rate declined from 66.8% to 66.7%. The weakness on both the demand and supply side appears to be linked to seasonal volatility in the post-pandemic labour market. The ABS highlighted it had detected changes in hiring patterns compared to historical trends, with school holidays falling during the survey period for the July series. A similar dynamic occured in April when employment also fell (-4.7k). Hours worked softened from a 0.4% lift in June to a 0.2% increase in July (5.2%yr). 


A rebound is expected in the August report...

Employment is anticipated to rebound by around 25k in August, although economists' estimates vary significantly from -20k to 50k. A fall in the unemployment rate from 3.7% to 3.6% is forecast (range: 3.6% to 3.9%), based on the participation rate remaining broadly unchanged (66.7%). The ABS's payrolls series provides support for the expected rebound. The payrolls index stabilised over the month to mid-August, improving from a decline (-0.3%) for the month to mid-July. 


... as employment growth remains key 

Amid rapid post-pandemic population growth and with labour force participation around record highs, sustaining solid momentum in employment growth is key to preventing a rise in unemployment. The RBA forecasts an uplift to 4.5% unemployment in a couple of years' time as below-trend economic growth leads to slowing employment gains. In my articles, I have highlighted that a more optimistic situation could evolve in which population growth keeps employment supported for longer than anticipated. Job vacancies are off their highs but remain elevated, consistent with an outlook for still-robust labour demand.  

Friday, September 8, 2023

Macro (Re)view (8/9) | RBA pause validated

Equities lost steam this week as US tech weighed on broad sentiment. The US dollar has continued to climb with the relative strength of the US economy seeing Fed rate cut prospects for 2024 being scaled back. Higher oil prices may have been key to bond yields trading with an upward bias over recent days. Next week's highlights include US CPI, the ECB's meeting, activity data from China and labour market updates in the UK and Australia.   


The RBA held the cash rate unchanged at 4.1% for the third meeting in succession this week (reviewed here) - the final meeting of Governor Philip Lowe's 7-year tenure. Signs that higher interest rates are gaining traction in bringing down inflation and slowing demand are keeping the Board on hold - consistent with its data-dependent reaction function. Although the Board maintains that "some further tightening of monetary policy may be required..." rates increasingly look to be at their peak in Australia. Markets anticipate the RBA will hold rates at this restrictive setting until well into next year - the timing of the first rate cut is currently priced to come in the final quarter of 2024. In his closing remarks speech, Governor Lowe forecast that inflation would be subject to increased variability - reflecting deglobalisation, climate change, energy transition and supply shocks - and that closer alignment between monetary and fiscal policy would be beneficial in managing inflation in that context.   

Australian GDP growth came in at 0.4% in the June quarter and 2.1% through the year. While the domestic economy remains resilient to headwinds here and offshore, growth slowed noticeably over the first half of 2023 (0.7%), validating the RBA's pause. Household consumption nearly stalled at 0.1% in the quarter under the higher cost of living - accentuated by rising interest rates and increased income tax liabilities. These pressures are binding on discretionary consumption (-0.5%q/q), which contracted over the first half of the year (-0.7%). Please take a look at my In review feature article covering the June quarter National Accounts for detailed insights on the Australian economy here.  


Many Federal Reserve officials gave their assessment on US rates this week, the general consensus validating expectations for a tightening pause at the September meeting. NY Fed President Williams perhaps summed up sentiments best by observing that monetary policy was "in a good place" with inflation coming down and supply-demand pressures in the economy easing - but that the FOMC needed to ensure this progress continued by remaining data-dependent. While a September pause is considered a done deal, markets are keeping the door open for a rate hike in November. Next week's CPI data will therefore be closely watched. Base effects are expected to see headline CPI firm from 3.2% to 3.6%yr in August, so markets are more likely to key off the core rate and this is forecast to ease from 4.7% to 4.3%yr. 

In Europe, attention is focused on next week's ECB meeting - anticipated to be a close call between a hold or a 25bps hike from the Governing Council. For a single mandate central bank of 2% inflation, additional tightening remains in prospect in spite of further signs of deterioration in the euro area economy. Q2 GDP growth was revised down to 0.1% from 0.3% and the composite PMI for August (46.7) indicated economic activity was deteriorating at an increased pace, while July retail sales fell 0.2%m/m (-1%yr). Bank of England Governor Andrew Bailey told the Treasury Committee this week that rates were "much nearer" their peak amid signs that inflation will continue to fall. UK wage and employment data will be important next week with markets leaning in the direction of a further two BoE hikes to a peak of 5.75%.  

Thursday, September 7, 2023

Australia's trade surplus narrows to $8bn in July

Australia's trade surplus was $8bn in July, below expectations ($10bn) and narrowing from $10.3bn in June (revised from $11.3bn). This was the nation's smallest monthly trade surplus since February 2022. Falling exports (2%) and rising imports (2.5%) drove the narrowing in the trade surplus. 


Following a 3.1% fall in June, exports declined a further 2% in July to $53.9bn, down 2.8% on 12 months ago. This month, volatile non-monetary gold (-31.9%) was the major factor. Declines in key commodity prices weighed on non-rural goods (-1.4%), with the value of these exports retracing substantially over the past year (-9.9%). Rural goods lifted 7.7%m/m to remain at elevated levels. Although lower prices have seen cereal exports decline, strong demand is supporting meat and other rural goods exports. 


Services exports softened in July (-1%) but are now in an expansionary phase having recently recovered from their pandemic-induced fall. This reflects the return of overseas visitors coming to Australia for holidays and to study.  


Imports lifted 2.5% in July ($45.9bn), mostly reversing a 3.3% fall in June. Broad-based strength was evident with goods (2.9%) and services (1.3%) advancing. Goods imports were supported by consumption goods (6.9%) - as vehicle imports rebounded (24.7%) - and capital goods (4.2%) on the back of telecommunications equipment (8.1%). By contrast, weakness came through in intermediate goods (-1.5%), which largely reflected a 4.9% side in fuel imports on lower prices. 


Services imports are up by a sharp 7.2%yr, with tourism services leading the way (39%yr). There was a further 1.3% lift from services in July as tourism rose 3%. Demand for overseas travel to Europe was very strong during the Australian winter. 

Wednesday, September 6, 2023

In review: Australian Q2 GDP: Pressures bind on discretionary spending

The Australian economy remains resilient to global and domestic headwinds, but the momentum in growth has slowed to a subdued pace. Real GDP growth was 0.4% in the June quarter - unchanged from an upwardly revised outcome (0.2%) in the March quarter - expanding by 2.1% through the year (from 2.4%). Over the second half of 2022, economic growth was a solid 1.3%; however, the pace slowed to 0.7% for the first half of 2023 as the pressure on households from the higher cost of living and rising interest rates intensified.


Growth dynamics offshore have been similarly challenged in 2023. In the G7, growth has been held up to a large extent by a resilient US economy, attenuating weakness in the euro area and the UK. In China, growth slowed sharply in the June quarter as the reopening lost momentum.   


Despite a very strong labour market, elevated inflation left Australian households significantly worse off as real incomes sustained a fall of historic magnitude over the past year. Associated with this, consumer sentiment has been at very weak levels for an extended period. 


Moreover, the transmission of the RBA's tightening cycle continued, with the earlier hikes to the cash rate (4.1%) flowing through to mortgage payments and fixed-rate mortgages rolling over to higher variable rates. Interest payments on dwellings rose to a 6.6% share of disposable income in the quarter, an 11-year high.  


In response to these headwinds, Australian household consumption growth slowed sharply over the first half of the year (0.4%), with discretionary consumption declining over the period (-0.7%). Nonetheless, aggregate consumption has still increased. Households appear to be drawing down on the large stock of excess savings accumulated during the Covid period to support consumption.  


As household consumption has slowed, two overarching factors have contributed to the resilience of the Australian economy. Firstly, rapid post-pandemic population growth (2.4%) has underpinned the rise in output over the past year (2.1%); in per capita terms, real GDP has fallen 0.3%Y/Y. 


Secondly, the reopening of the borders has facilitated the recovery of services exports, led by the tourism and education sectors. This has contributed more than 2ppts to GDP growth over the past year. 


The growth slowdown reported in the June quarter National Accounts largely validates the decisions by the RBA Board to leave the cash rate on hold at its past 3 meetings. Although the Board retains its tightening bias given the risk of persistent inflationary pressures, an extended pause looks the likely path for monetary policy from here. 


— — 

National Accounts — Q2 | Expenditure: GDP (E) 0.4%q/q, 2.5%Y/Y


Household consumption (0.1%q/q, 1.5%Y/Y) — The momentum in household consumption continued to slow due to cost-of-living pressures and higher interest rates. Household consumption nearly stalled at 0.1% in the quarter, increasing by a tepid 0.4% in the first half of 2023, well down from the 1.1% pace realised over the back half of 2022. 


Very strong labour market conditions drove household incomes to their fastest increase since 2011 at 8% over the year to the June quarter. But that increase was eaten into substantially by mortgage interest payments that have more than doubled (106.9%Y/Y) due to RBA rate hikes and by a surge in income tax liabilities (15%Y/Y). Those factors left disposable income up by a modest 2.3%Y/Y. Then there is the effect of elevated inflation, which at 6.1%Y/Y on the household consumption deflator implies a historic fall in real incomes of around 3% over the past year. In that environment, households have been saving less and less of their disposable income in order to support consumption; the household saving ratio fell to a 15-year low in Q2 at 3.2%.


Although consumption has still risen, the real income squeeze has had a profound effect on demand patterns. Discretionary-related consumption surged coming out of the pandemic, but households have put the brakes on over recent quarters (-0.5%q/q, 0.6%Y/Y), resulting in essential goods and services (0.5%q/q, 2.1%Y/Y) taking up the running as the major impulse to household consumption. 


That said, there are still areas of consumption that remain resilient, including in discretionary-related categories. Notably in the June quarter, new vehicle purchases surged (5.8%) - partly catching up from earlier delays across the ports - while the desire the travel and go out continued to support transport services (3.2%) and hotels, restaurants and cafes (0.2%). The largest pullback in Q2 was in furnishings and household goods (-2.5%), with the category continuing to normalise after surging during the pandemic lockdowns.  


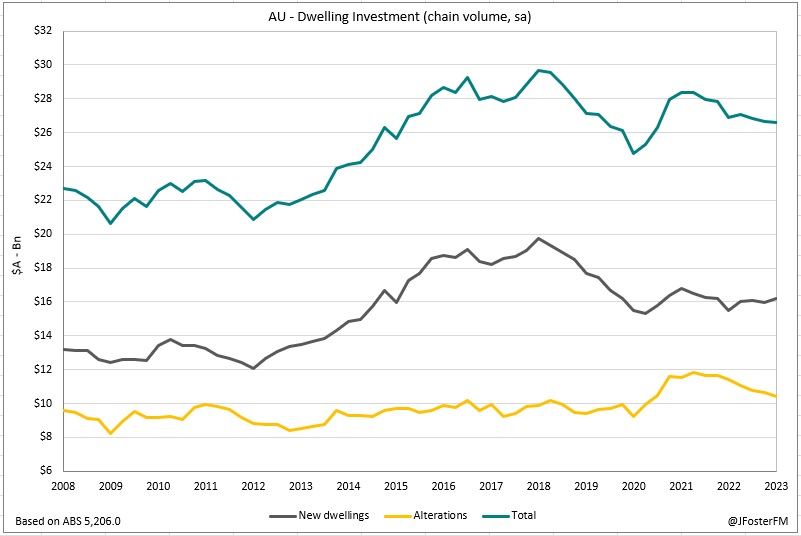
Dwelling investment (-0.2%q/q, -1.1%Y/Y) — Higher interest rates and capacity constraints have weighed on dwelling investment over the past year (-1.1%). In the June quarter, the decline was a relatively modest 0.2%. A welcome rise in new home building came through in the quarter (1.2%) driven by higher-density housing, with detached home building still under pressure from delays. Alterations (-2.4%) continued to unwind from their peaks reached in response to the stimulus measures that supported this activity during the pandemic. 


Ownership transfer costs — fees associated with real estate transactions — lifted by 3.9% in the June quarter, its first rise since Q3 2021. This came amid a tight supply-demand balance driving an upturn in housing prices. 

Business investment (2.1%q/q, 8.0%Y/Y) — A 2.1% rise in the June quarter saw business investment up by 8% through the year, an upturn that has defied the headwinds of slower global and domestic growth and tighter financing conditions. 


Key factors in this resilience have been firms responding to capacity pressures that emerged through the Covid period and progress in the transition to renewable forms of energy. In addition, federal government tax incentives that expired at the end of the 2022/23 financial year brought forward spending, reflected in business investment rising by a sharp 5.7% over the first half of the year. 

Machinery and equipment (4.3%) drove business investment in the quarter as global supply chain pressures eased. Intellectual property products (2.2%) posted the fastest quarterly rise in 2 years. Non-dwelling construction (0.3%) was subdued in Q2 but has risen materially over the past year (10.8%) as commercial and infrastructure projects have gathered pace.

  
Public demand (1.2%q/q, 2.7%Y/Y) — Public demand was a key support to growth in the quarter, adding 0.3ppt to real GDP. As a share of real GDP, public demand remains elevated averaging around 27.5% over the year to the June quarter, well above its pre-pandemic share of output. New investment accelerated by 5.2%q/q (9.4%Y/Y), reflecting progress on major transport, health and education projects across the nation. Government expenditure lifted 0.4%q/q (1.4%Y/Y).   


Inventories (-1.1ppts in Q2, -1ppt yr) — A number of factors led to a large decline in non-farm inventories of $3.4bn (chain volume terms) in the quarter, subtracting a substantial 1.1ppts from output. The clearing of port delays facilitated the delivery of new vehicles and equipment. Disruptions that previously affected mining production eased, supporting the export of these commodities. Meanwhile, offshore grain shipments led to a decline in wholesale inventories.    


Net exports (0.8ppt in Q2, 1.2ppt yr) — Made the largest contribution of all the expenditure components to GDP growth in Q2 (0.8ppt). Export volumes lifted 4.3%q/q (9.8%Y/Y), recovering to pre-pandemic levels. Reopened borders continued to facilitate the recovery of the domestic tourism and education sectors. This saw services exports advancing by a further 12.1%q/q to be up 50.9% through the year. A rebound in resources shipments (2.4%) also supported exports in Q2. Import volumes were up a modest 0.7% in the quarter, now 8.2% above pre-pandemic levels. Travel services (11.2%) were the major driver, reflecting many Australians travelling to the northern hemisphere for leisure.


— — 

National Accounts — Q2 | Incomes: GDP (I) 0.3%q/q, 2.1%Y/Y 


Weaker global growth dynamics hit national income in the June quarter as the prices of Australia's major export commodities declined. In the quarter, export prices fell by 8.2% generating a 7.8% contraction in the terms of trade. This was the largest quarterly fall in 14 years and left the terms of trade down 12.7% on the record high from a year earlier. 


Reflecting the terms of trade fall, nominal GDP contracted by 1.2%q/q, which saw growth through the year slowing from 9.5% to 3.6%. Falling nominal GDP was driven by a 1.5% decline in prices - influenced heavily by the fall in export prices - resulting in the real income estimate of GDP lifting 0.3% in the quarter (2.1% year-ended).


Household income continued to be bolstered by the very strong labour market. Robust labour demand led to increased hiring and hours worked, the latter advancing 2.5% across the economy in the quarter (and 2.2% in the market sector). These dynamics drove the compensation of employees measure to a 1.6% rise in Q2 to be up 9.6% through the year. 


On an hourly basis, non-farm compensation was running at a 3.1% year-ended pace. But the underlying cost of labour for firms has increased at a materially stronger pace after accounting for productivity trends, which have been weak - a key concern highlighted by the RBA as it could sustain high inflation if firms respond by continuing to raise prices. Non-farm unit labour cost growth was 7.3%Y/Y and 4.9%Y/Y in real terms. 


Amid a range of headwinds from falls in commodity prices, margin pressures and slowing demand, private sector (ex-financials) company profits fell 8.6% in the quarter, their largest quarterly decline since 1991. That outcome drove a swing in through-the-year profits from 15.1% to -6.8%. 


Gross mixed income (small business and farming profits) was also hit, contracting by 2.7%q/q and 8.8%Y/Y. By contrast, financial company profits lifted 1.2%q/q to 7.2%Y/Y; more fixed-rate mortgages are rolling on to higher variable rates, while the RBA's tightening cycle has driven an expansion in net interest margins. 

— — 

National Accounts — Q2 | Production: GDP (P) 0.4%q/q, 1.7%Y/Y

The GDP production approach estimate was 0.4% in the June quarter, in line with the outcomes for the expenditure approach and the headline figure. The year-ended growth rate moderated from 2.2% to 1.7%. Gross Value Added (GVA) increased at a similar pace for business services (0.6%) and household services (0.7%). By contrast, the goods sector was patchy: goods production advanced (0.5%) as goods distribution softened (-0.1%). 


Business services (0.6%) saw broad-based strength across the sector. The upturn in housing prices led to increased activity for real estate services (2.7%). Administration advanced (1.8%) on stronger demand for travel services and labour hire. Professional services (-0.3%) was a point of weakness. Turning to household services (0.7%), increased demand for public health services (0.9%) was the main support. Inbound tourism boosted the accommodation and food services industry (0.4%).   


GVA from goods production (0.5%) was led by construction (2.2%) and utilities (2.9%). Construction output was supported by increased sub-division activity and by progress on infrastructure projects. Cool weather in the lead-up to winter led to a lift in household electricity and gas consumption that drove utilities. This was moderated by a 1.3% fall in mining, reflecting disruptions to iron ore operations caused by Cyclone Ilsa. Goods distribution (-0.1%) was hit by weakness in retail demand and by an easing in grain trade, both weighing on the wholesale industry (-1.5%). This weakness was largely offset by the transport industry (1.1%) as demand for domestic and offshore travel remained strong.