Independent Australian and global macro analysis

Friday, July 30, 2021

Macro (Re)view (30/7) | Risks to the outlook on the rise

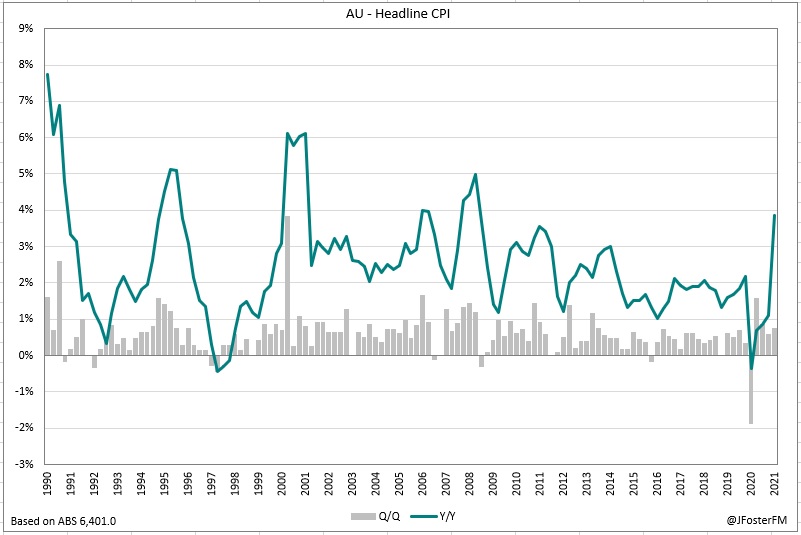
Australian inflation printed a touch stronger than expected this week with the headline CPI measure rising by 0.8% in the June quarter (vs 0.7% expected). Reflecting the reversal of many cost-saving measures introduced by governments to support households at the onset of the COVID  free child care being the big-ticket item  and fuel prices rebounding to above pre-pandemic levels, annual CPI lifted by 2.7ppts to 3.8% to be at its highest since 2008 (reviewed here). Added to these base effects were a range of temporary factors. The chart below shows the top ten contributors to Q2's CPI outcome, which includes private health insurance premium rises; supply-side constraints leading to higher prices for fruit, vegetables and meat; strong demand and limited supply driving vehicle prices higher; as well as the unwinding of an electricity rebate in Perth.    

Chart of the week  

Supporting the view that the rise in headline inflation has a transitory nature, measures of underlying CPI that remove the most volatile price changes, were only modestly higher and remained below the bottom of the RBA's 2-3% target band. Trimmed mean CPI was 0.5% higher in Q2 taking the annual rate off its record low of 1.1% to 1.6%; the weighted median also increased by 0.5%q/q as the year-on-year pace firmed to 1.7% from 1.3%. Overall, the tension between headline inflation at 3.8%Y/Y and underlying inflation at around 1.6%Y/Y will give the RBA confidence that its assessment of the inflation dynamics is correct, meaning that this week's report should have few implications for policy ahead of next week's meeting, particularly with the pandemic situation being far more pressing.  

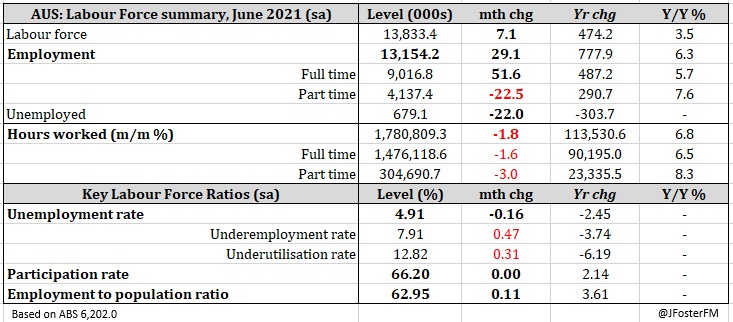
With Sydney's lockdown being tightened and extended until at least the end of August, the RBA's GDP growth forecast for 2021 of 4.75% is likely to take an even larger downgrade in its updated quarterly statement than was the case just a week ago. The path for the unemployment rate will be recalibrated to reflect its faster-than-expected decline, though the GDP downgrade will temper expectations around the outlook. It shapes as increasingly likely that the RBA will have to defer its guidance to commence tapering its QE purchases from early September. As covered last week, another option for the RBA would be to scale up the pace of its purchases, to $6bn/wk from $5bn, though my sense is that the Board will be more likely to land on delaying tapering at this stage. Given the signal announced at the July meeting was that purchases would reduce to $4bn/wk once the second $100bn tranche had been completed, reversing that guidance would in effect ease the overall monetary policy stance as purchases would stay at $5bn beyond early September. But in the current situation, the key anchor of support comes from fiscal policy, making this week's announcements from the federal and NSW state government to increase and expand support for workers and businesses welcome developments.    

— — 

Switching the focus offshore, in the mix was increasing risks to the global economic recovery due to the delta strain, the latest Federal Reserve meeting, some key data points and a regulatory crackdown on education and tech names that unsettled Asian equities. While the IMF kept its GDP growth forecasts for this year and next unchanged at 6.0% and 4.9% respectively, the group made offsetting revisions with the outlook for 2021 in advanced economies revised up (to 5.6% from 5.1%) but marked down in emerging and developing economies (from 6.7% to 6.3%) due to increased fiscal stimulus and higher vaccination coverage driving the divergence. As noted by the IMF in its July World Economic Outlook update, the risks to growth prospects were to the downside due to slow vaccination roll-outs in many nations that leave them vulnerable to further outbreaks and mutations of the virus. Another key risk mentioned by the IMF resides around high inflation remaining more persistent than anticipated, which could prompt a tightening in financial conditions if the outlook for monetary policy is abruptly revised by markets.

At the meeting of the Fed's FOMC this week, all policy settings were left unchanged as Chair Jerome Powell continued to deliver a familiar message that still suggests the start of QE tapering remains a little way off. Key to that process is conditions in the labour market, with the FOMC needing to see "substantial further progress" in the recovery before it considers lowering purchase from the current pace of $120bn per month. In the post-meeting press conference, Chair Powell said that there while there were signs that the labour market was "making progress" there was still "some ground to cover" in terms of moving closer towards its maximum employment objective. On the Committee's transitory definition of inflation, Chair Powell said that there had been few signs that price rises driven by supply chain bottlenecks were becoming embedded in forward-looking inflation expectations and as such were unlikely to be permanent. There were, however, signs that these factors are weighing on activity as June quarter real GDP growth missed estimates coming in at 1.6%q/q. On a side note, this outcome now sees US GDP slightly higher than pre-pandemic levels (+0.8%). While the consumption side of the economy remains strong — growth in personal spending lifted by 1.0% in June driven by an increasing rotation back towards services-related areas (1.2%m/m) on the widening reopening — both inventories and residential construction subtracted from output during the quarter, with rising materials costs and labour shortages particular constraints in the latter. This combination of strong consumer demand and supply chain pressures saw the Fed's preferred core PCE inflation measure a little firmer in June at 3.5%Y/Y from 3.4%. 

In Europe, data this week confirmed the encouraging progress reported in the soft indicators that the recovery in the continent is back on track from the virus-driven setback it endured over the past two quarters. Growth in real GDP came in stronger than expected advancing by 2.0%q/q (vs 1.5% forecast), though this still left activity around 3% down on pre-pandemic levels. Across the major economies in the bloc, growth in Spain (2.8%q/q) and Italy (2.7%q/q) led the way to more moderate rebounds in Germany (1.5%q/q) and France (0.9%q/q). But with economies now opening up more widely, there aren't the same extent of supply-side pressures as in the US. July's preliminary inflation reading for the euro area moved up from 1.9% to 2.2%Y/Y (vs 2.0% expected), though the core rate slowed from 0.9% to 0.7%Y/Y (as expected). Rounding out the week, further signs that the reopening is taking shape was was seen with the fall in euro area unemployment from 8.0% to 7.7% (vs 7.9% expected).

Tuesday, July 27, 2021

Australian Q2 CPI 0.8%, 3.8%Y/Y

Australia's Consumer Price Index (CPI) accelerated to its fastest since 2008 at 3.8%Y/Y reflecting the reversal of many cost saving measures introduced by governments to support households through the onset of the pandemic. A rebound in fuel prices to above pre-pandemic levels were the other major contributing factor to the increase. But, despite this, the underlying measures of inflation remain below the RBA's target band.  

Consumer Price Index — Q2 | By the numbers 
  • Headline CPI (not seasonally adjusted) printed at 0.8% in the June quarter, coming in ahead of the median estimate of 0.7% and up from 0.6% in Q1. Base effects accelerated annual CPI from 1.1% to 3.8% to be at its highest since Q3 2008. Seasonally adjusted CPI was 0.8%q/q, with the annual pace advancing to 3.7% from 0.9%. 
  • Details for the underlying measures (measures are seasonally adjusted);
    • Trimmed mean came in close to expectations at 0.47%q/q, lifting the annual rate off a record low of 1.13% to 1.63%.
    • Weighted median increased by 0.48%q/q as the pace through the year firmed to 1.67% from 1.29%.


Consumer Price Index — Q2 | The details 

Australian headline inflation was a touch stronger than markets had anticipated rising by 0.8% in the June quarter and a touch firmer than the 0.6% increase in the previous quarter. Prior to the lockdowns either ongoing or just lifted in some of the nation's capital cities, the domestic economy was opening up more widely and was performing strongly. As a result, fuel prices had rebounded above pre-pandemic levels and many of the cost saving measures introduced by governments to support households through the national lockdown, including free child care services, rent reduction mechanisms and rebates on utilities, had reversed. Thus with price levels in a reopened economy being compared against the depths of the pandemic last year, this saw annual CPI accelerate sharply from 1.1% to 3.8% to be at its fastest in nearly 13 years. 


Measures of underlying annual inflation also lifted due to base effects in the June quarter, but both the trimmed mean (1.63%) and weighted median (1.67%) measures remain subdued and are short of the bottom of the RBA's 2-3% target band. The broader CPI ex-volatiles measure lifted more sharply, from 1.36% to 3.11%, as this measure still picks up the effect of the reversal of free child care but removes the impact of higher prices for fuel and fruit and vegetables.  


Overall, goods-related inflation (2.0%Y/Y) remained stronger than in services (1.5%Y/Y), though the spread had continued to narrow as consumption patterns were adjusting to the wider reopening.    


Turning to analysis of the main CPI groups, the chart below shows the contribution of each of the groups to the quarterly CPI outcome of 0.8%. The largest contribution came from the transport group (0.35ppt), with higher fuel prices making up 0.26ppt of this to account for one-third of the rise in inflation in Q2. Other major influences boosting inflation in the quarter were from food and non-alcoholic beverages (0.11ppt) reflecting higher fruit and vegetable prices (0.14ppt) due to supply constraints from labour shortages and extreme weather events on the east coast. The contribution from the health group (0.12ppt) was driven by medical, dental and hospital services (0.13ppt) as private health insurance premiums increased on April 1. At the other end of the scale, the main item that weighed on quarterly CPI was meals out and takeaway food (-0.05ppt) (this is part of food and non-alcoholic beverages) due to the impact of voucher schemes that were implemented by state governments as a pandemic response measure to support restaurants and cafes in Sydney and Melbourne by subsidising meal costs. Domestic travel (part of recreation and culture) subtracted 0.04ppt from quarterly CPI reflecting the Federal Government's support package that subsidised airfares to selected destinations as well as increased completion from local tourism operators to attract business.


Quarterly and annual price changes (in % terms) for each of the major CPI groups are shown in the chart below. 


In terms of annual growth, furnishings, household equipment and services (16.9%yr) was at the top of the pile, which mainly reflects the reversal of the Federal Government's decision to provide all families with free child care services during the national lockdown a year ago. As a result, the child care index was up an extraordinary 2,009% over the year. Meanwhile, strong demand for furniture and furnishings (and other durables) as a result of stay-at-home restrictions drove a 5% price increase for these items over the year.   


The transport group lifted by 10.7%Y/Y as fuel prices lifted above pre-pandemic levels to be 27% higher than a year earlier. In Q2 alone, fuel prices were up 6.5% on the wider reopening of the Australian economy, and as highlighted above, this accounted for one-third of the increase in quarterly CPI. Strong demand for new vehicles amid the global semi-conductor shortage led to car prices rising by 7.4% over the year. 


The key housing group (accounting for around 24% of the CPI) saw prices lift 0.3% in Q2 but were slightly lower (-0.2%) over the year. Rents nationally were flat in the quarter, while annual growth increased from -1.4% to a flat outcome. The lift in annual growth came as a sharp 1.3% fall in Q2 last year on the back of the introduction of rent reduction mechanisms rolled out of the calculation.  


Conditions in rental markets have also varied considerably across the nation with declines in Sydney (-1.5%Y/Y) and Melbourne (-0.8%Y/Y) offset by gains in Perth (3.3%Y/Y), Hobart (2.8%Y/Y), Adelaide (1.8%Y/Y) and Brisbane (1.7%Y/Y).   


New dwelling prices were reported as falling by 0.1% in Q2 due to the effect of the Federal Government's HomeBuilder grants, which are reflected as lowering the price of new homes. However, the ABS notes that if the HomeBuilder scheme is excluded, new dwelling prices would have lifted by 1.9% in each of the past two quarters due to higher materials and labour costs. 


Meanwhile, household utilities prices were up 1.7% in Q2 as electricity prices lifted by 3.3%. This was driven by the unwinding of a government rebate on electricity in Perth. But rebates are in effect in other states, such that electricity prices would have fallen by 2% in the quarter if the unwind in Perth was excluded. 


Inflation across food and non-alcoholic beverages (around 17% of the CPI) lifted by 0.5% in Q2 with the annual pace unchanged at 0.7%. The strongest price rises over the past year have been in beef and veal (13.5%) and fruit (6.0%) due to supply constraints affecting both categories. Higher meat prices are being driven by herds being rebuilt after the end of the drought in early 2020, while a lack of labour supply (pickers) and the impacts of flooding and cyclones lifted fruit prices.   


In the recreation and culture group (around 9% of the CPI) prices declined in Q2 (-0.1%), though the annual pace moved up from 1.5% to a 7-year high of 2.5% on a combination of base and reopening effects. While domestic travel costs declined by 1.3% in Q2 reflecting the Federal Government's discounted airfare scheme, international travel was up by 8.6% in the quarter as the travel bubble (which is now suspended) with New Zealand opened up.   


For the health group (6% of the CPI), Q2's rise of 1.5% lifted annual growth to 4.8% to its highest in 5½ years. The driving factor this quarter was a 2.4% lift in medical and hospital services that reflected private health insurance premiums rising from April 1. 


Price increases across the rest of the CPI groups were subdued in Q2: alcohol and tobacco 0.4%, clothing and footwear 0.4%, financial and insurance services 0.3% and education 0.0%. Meanwhile, the communication group continued to fall (-0.6%) reflecting discounting for phone services. 

Consumer Price Index — Q2 | Insights 

The inflation data continue to be distorted by policy and pandemic-related factors, but the underlying measures remain short of the RBA's 2% lower target. Thus there is little reason to think that the surge in headline inflation is anything but transitory and will therefore be of little consequence to policymakers. Many economies offshore have seen price rises accentuated by supply constraints as they have reopened, though these pressures have been less prevalent in Australia.

Preview: Australian CPI Q2

Australian's inflation report for the June quarter is scheduled to be released by the ABS today at 11:30am (AEST). Similar to what has been seen around the world, Australian inflation is expected to accelerate due largely to statistical base effects with prices in reopened economies being compared against the depths of the pandemic when lockdowns were in place. Capacity constraints have accentuated price rises in many economies as they reopened, though these pressures appear to have been less prevalent in Australia due to shorter lockdowns and a less severe hit to the economy as a result. But the reversal of government policy decisions to support households through the lockdowns is expected to drive annual Australian CPI to its highest in many years in Q2. 

As it stands CPI 

In the March quarter, Australian inflation was weaker than expected with headline CPI printing at 0.6%q/q (vs 0.9% forecast). Annual CPI lifted from 0.9% to 1.1% but was below the 1.4% pace anticipated.


Measures of underlying inflation also surprised to the downside of estimates. The trimmed mean was 0.35%q/q (vs 0.6% expected), with the annual pace easing from 1.2% to a record low of 1.1%, while the weighted median printed at 0.4%q/q, maintaining a 1.3%Y/Y pace.


Sources of inflation were narrowly based in the March quarter, with automotive fuel contributing 0.33ppt to the 0.6% lift in headline CPI. Fuel prices increased by 8.7% in the quarter but were still below pre-pandemic levels, down by 3.6% on a year earlier. Outside of this, the health group added 0.15ppt to quarterly CPI, reflecting the annual reset for accessing subsidies under the Medicare Safety Net and PBS, while food and non-alcoholic beverages contributed 0.07ppt to CPI in Q1 driven by higher prices for meat and takeaway food.


Weighing on the CPI was the impact of the Federal Government's HomeBuilder grants, which are treated as a subsidy and thereby lower new dwelling prices. This restricted the housing group to just a 0.1% rise in Q1 (0.02ppt), with the price of new dwellings recorded as falling by 0.1%. However, if the impact of the HomeBuilder grants was excluded, the ABS reported that new dwelling prices rose by 1.9% in the quarter, due to rising labour and materials costs. Meanwhile, rents nationally were held flat in Q1 as declines in Sydney (-0.3%), Perth (-0.1%) and Darwin (-1.5%) offset rises in the other capital city markets.  


Cost saving measures introduced by governments to support households continued to weigh on utilities prices, falling by a further 0.2% in Q1 to be down by 7.4% over the year. Utilities fell by 0.9% in Melbourne reflecting a reduction in market and standing offers as well as rebates for some customers. In addition, other cost savings for households were also evident with education costs falling over the past year as a result of many schools implementing fee freezes. For tertiary education, a 1.7% fall in prices in Q1 was driven by the Federal Government's Job-ready Graduate Package.     

 
Market expectations CPI

Headline CPI is forecast to rise by 0.7% in Q2 on the median estimate between a range of forecasts from 0.4% to 0.9%. Annual CPI is expected to accelerate significantly from 1.1% to 3.8% driven by base effects due to prices in a strong and reopening economy being compared back to the depths of the pandemic 12 months ago when fuel prices had plunged lower, the Federal Government was providing all families with free childcare, state governments had provided relief to households through rent reduction mechanisms and rebates, and many retailers were cutting prices to drive sales before the lockdowns came in. Trimmed mean inflation is forecast to lift by 0.5% in Q2, with the annual pace expected to firm from 1.1% to 1.6%.  

What to watch CPI 

The combination of base effects and the ongoing influences from the HomeBuilder grants and weakness in administered prices means that the headline inflation measure will contain many distortions. Thus the focus should turn to the underlying measures for a better read on the true inflationary pulse in the economy. Another area of interest is the mix between goods-related and services inflation. The former has been the driving influence over the pandemic period reflecting shifts in consumption patterns, but historically the impulse from the 'stickier' services side has been key to inflation trends. 

Friday, July 23, 2021

Macro (Re)view (23/7) | Moving the delta

The spreading of the delta strain continues to concern markets and pose major risks to the continuation of economic recoveries. This is becoming increasingly evident in Australia with Sydney's lockdown looking like it will remain in place for a while yet, while Melbourne and Adelaide are also currently under stay-at-home restrictions until at least next week, and internal border controls have tightened further over the past week. While caseloads are low by global standards (7-day average over the past week was around 140*), vaccination coverage is also low at around 12%* for both doses (*Johns Hopkins data), so the authorities have opted for city-wide (and in some cases state-wide) lockdowns. Data to hand this week indicates that there has been a sharp loss of momentum in the economy as a result, turning the attention to policymakers. 

In the minutes of the RBA's July meeting, it was revealed that the decision by the Board to signal its intention to start tapering its QE purchases from $5bn to $4bn per week in early September was a close-run thing. There were arguments to maintain the existing pace on the basis that employment and inflation were still short of meeting the RBA's goals but in the end a stronger-than-expected recovery and a positive outlook meant that the decision went the way of announcing the start of tapering. But that was before restrictions had been extended and tightened and before the data started rolling over. The exception to this will be next week's CPI data, which will spike north of 3%Y/Y in headline terms in Q2, but the RBA has repeatedly said it will treat the increase as transitory. At the August meeting, the RBA will revise its economic forecasts and with activity likely to contract in Q3, there will be a sizeable downgrade to GDP for 2021 from 4.75% currently. While unemployment has significantly outpaced expectations: the unemployment rate at 4.9% is around where the RBA thought it would be mid next year, the risk of some reversal here is clear, while the pandemic situation means the path forward has become very uncertain. In the circumstances, it could be difficult for the RBA to maintain its taper guidance and the outperformance in the Australian 10-year bond this week (see table below) speaks to this. The increased flexibility the RBA has allowed for its QE purchases post September means there is potentially some chance that the pace of purchases could be dialed up from $5bn/week depending on how the data comes in. The chart below illustrates these various QE scenarios. The situation could also result in additional fiscal support, providing offset to the impact to incomes from lockdowns and restrictions and then serving to spur spending when reopenings come. 

Chart of the week 

The extent to which the data has been hit by the setback with the pandemic was highlighted in the flash PMI reading for July, which fell to its weakest reading in 14 months at 45.2 from 56.7 in June (readings > 50 signal activity is expanding). The impact of restrictions has been heavy on services, with activity in the sector flipping from rising strongly (56.8) to now be going backwards (44.2) at pace. In keeping with one of the major themes of the pandemic, manufacturing stood resilient, albeit with activity rising at a slightly slower speed (58.6 from 56.8), and could be supported by a rotation in spending back towards goods-related areas as lockdowns and restrictions persist. The reintroduction of restrictions led to a sharper-than-expected fall in retail sales for June, with the ABS's preliminary estimate falling by 1.8%m/m (vs -0.7% expected). Declines came through in all the major states: New South Wales -3.5%, Victoria -2.0% and Queensland -1.5% as capital cities entered periods of lockdown. Signs of strain were also showing in the ABS's high-frequency labour market data, with the national payroll jobs index falling by 1.0% over the fortnight to 3 July. Over the period, payrolls fell in all states and capital cities, with the sharpest falls occurring in New South Wales (-1.4%) and greater Sydney (-1.9%). Softness in job vacancies in June (-0.5%m/m) portends further disruption from lockdowns. But using previous lockdowns as a rule and considering the elevated level of vacancies (around 1.8% of the labour force), underlying labour demand seems likely to ride out the restrictions with hiring to return as reopenings take place. There was good news on the trade front in June as preliminary estimates from the ABS showed goods exports rising through $41bn for the month to record highs, driven by the tailwinds from elevated iron ore prices.  

— — 

Offshore, the European Central Bank's keenly awaited meeting this week saw all policy settings left unchanged, though the main story related to the recalibration of the Governing Council's forward guidance on interest rates in response to its newly-minted symmetric 2% inflation target. This change hinted at a more dovish approach to policy and that was confirmed in the Governing Council's decision statement where forward guidance for the timing of rate hikes was linked strongly to its inflation forecasts. Specifically, the Governing Council now needs to see 2% inflation as being on the radar, but coming "well ahead of the end of its projection horizon" and then seeing enough signs from underlying measures of inflation to believe that it will stay at that level over the remainder of the period. Currently, the ECB's forecasts stretch out to 2023 but inflation is only seen running at 1.4%Y/Y by then, indicating that rate hikes are now an even more distant proposition. In the post-meeting press conference, ECB President Christine Lagarde said that its tweaked forward guidance was aimed at ensuring that it avoids tightening policy prematurely, noting that the new inflation mandate now gives the Governing Council the scope to tolerate periods of overshoot on its 2% target. While the need to alter forward guidance was seen as unanimous, media reports quoting ECB sources outlined that there had been at least two Governing Council members that had objected to the changes ultimately made. Nothing has changed with regard to the ECB's asset purchases, with the pace of purchases in its pandemic line (PEPP) continuing to be accumulated at a "significantly higher" run rate than earlier in the year and with no hint as yet as to what will occur when the PEPP is due to be wound up in March next year (though it can be extended beyond this date). 

On the economy, the ECB anticipates a robust second half of the year, supported by a wider reopening over the summer leading to GDP returning to pre-pandemic levels by Q1 next year. Though it acknowledges the delta strain as a key uncertainty, its overall assessment is that risks to its outlook for the economy are broadly balanced. Certainly, the ECB will have liked what they saw from July's flash PMI reading where euro area activity on the composite index accelerated to its strongest since 2000 at 60.6 from 59.5 in June. Activity in services sectors was rising at its fastest pace in 15 years, with businesses in tourism and hospitality benefitting from loosened restrictions and increased vaccinations. But there were reasons to be cautious, with business confidence sliding to a 5-month low pointing to the potential delta impact. Meanwhile, in the manufacturing sector activity had come off its recent highs but was still elevated at a 62.6 reading. Supply-side bottlenecks remain significant, with backlogs rising to record highs and prices pushing higher as a result. In the UK, capacity constraints appear to be material concerns at a time when the economy is looking to move up in gear following the removal of pandemic restrictions. July's flash PMI reading slowed from 62.2 to 57.7, with both the services and manufacturing indexes easing back to 4-month lows but still well in the expansionary range. Concerns around rising virus caseloads have added to ongoing issues businesses are reporting with regard to staffing shortages and supply chain disruptions. This was keeping upward pressure on prices, but as discussed in a speech this week by the Bank of England's Deputy Governor Ben Broadbent many of the contributing influences were expected to be transitory and not something for the monetary authority to respond to through tighter policy. Next week, the attention turns back to the US for the Federal Reserve's policy meeting where markets will continue to assess prospects for the tapering timeline amid a range of top-tier data releases including GDP (Q2) and personal consumption (June). 


Friday, July 16, 2021

Macro (Re)view (16/7) | Inflation outlook drives policy divergence

Australia's labour market continued its strong recovery as a 29.1k rise in employment in June outperformed expectations, pushing the national unemployment rate down from 5.1% to 4.9% to be at its lowest in 10½ years (reviewed here). At the nadir of the 2020 national lockdown, the unemployment rate lifted to a 22-year high peaking at 7.4% (see chart below), with the stunning turnaround over the past 11 months reflecting the highly elevated pace at which jobs were returned to the economy once the reopening effort commenced, far exceeding the limited growth in the working-age population due to the border restrictions. Also helping drive the decline in unemployment in the month was the participation rate remaining steady at 66.2%, sitting just a fraction below its record high. June's increase in jobs was an encouraging outcome considering that it followed a 115.2k surge high in May, taking total employment to 1.2% above its pre-pandemic level. However, the outlook over the near term has become very uncertain with the nation's two largest capital cities in lockdown. Sydney's lockdown has been extended until at least the end of the month, while stay-at-home restrictions have returned in Melbourne for the next 5 days only a few weeks after a two-week lockdown was lifted.  

Chart of the week

Highlighting the effect of the lockdown in Victoria was weakness in hours worked, which collapsed by 8.4% in the state in June, driving a 1.8% fall in the national outcome. A very sharp decline in hours worked in New South Wales will flow through in July, and as this week's report highlighted, there are implications for the level of spare capacity in the labour market. With the Victorian economy shut down, there were 33.4 million fewer hours worked in Australia in June compared to the month prior, which drove up rates of underemployment (7.4% to 7.9%) and underutilsation (12.5% to 12.8%). Given the hit to incomes for households and businesses flowing off the back of this, the announcements by the fiscal authorities to increase and expand access to support payments will go some way to attenuating the risks of a more material impact on the economic recovery. Another factor key to sustaining the momentum in the recovery is consumer sentiment, which for the time being was holding up at optimistic levels, rising by 1.5% in July to a reading of 108.8 on the Westpac-Melbourne Institute's index. But beneath that outcome was a wide divergence across the states, with New South Wales -10.2% offset by reopening rebounds in sentiment in Victoria (15%) and Western Australia (11.5%). The lengthening lockdown in Sydney could lead to further weakness in New South Wales, while Victoria is now at risk of reversing this gain due to the spreading of the delta strain. There could also be spillover effects on sentiment in the other states, based on the signals coming from high-frequency data for card spending and mobility. 

Pressures on businesses were also starting to show as a result of the rise in COVID-related concerns. In the June NAB Business survey, measures of both confidence (+11 from +20) and conditions (+24 from +36) stepped down from what must be said were very elevated levels, the latter coming off a record high in the month prior. Given this, and the timing of the survey, it is difficult to be clear just yet on the extent to which the pullback can be attributed to the deterioration in the pandemic situation, but clearly, it is an adverse development and businesses may be sensing that the impact to trade from lockdowns could last for a while longer with vaccination rates still at low levels. On vaccinations, the ABS Household Impacts of COVID-19 Survey reported that overall willingness to receive the dose had risen to 73% in June, up from 68% in May. Among other findings in the final release of the survey that has been a timely source of insights throughout the pandemic period, expectations for wages growth on a 12-month-out view were soft, with only around 30% of households expecting an increase despite the strength of the recovery in employment. 

— — 

Inflation has been front and centre of developments offshore this week, with Federal Reserve Chair Jerome Powell staying resolute in the line that price pressures will prove transitory amid more hawkish tones being taken by other central banks. All the while the bond market has remained unphased by hot inflation data — the US 2/10 Treasury yield spread narrowed further this week to its lowest since February. US CPI inflation printed well above consensus forecasts rising from an annual pace of 5.0% to 5.4% in June (vs 4.9% expected) — its highest since 2008  as the core rate accelerated to its fastest pace since 1991 at 4.5%Y/Y from 3.8% (vs 4.0% expected). Once again, reopening pressures were the main contributors, with energy prices (24.5%Y/Y) now much higher compared to during the lockdowns a year ago; used cars and trucks resetting record highs (45.2%); and very sharp increases for airfares (24.6%), hotels (16.9%) and for a range of household durable goods. Reflecting the shifts in spending patterns driven by the onset of the pandemic, and now the supply-side bottlenecks with the economy attempting to rebuild its previous capacitythere remains a very significant spread between durables CPI (14.6%Y/Y) and services CPI (3.2%Y/Y), though the latter is seeing the price impulse lift with rents picking up and as demand for domestic travel rebounds. Those expecting high inflation to prove more sustained will point to the acceleration in producer prices, up from 6.6% to 7.6%Y/Y in June, as a sign that more price pressures are coming down the pipeline and will be passed through to consumers with spending robust. Speaking to this was June's stronger-than-expected rise for retail sales, which advanced 0.6% in the month while control group sales posted a 1.1% lift. But during this week's testimony, Chair Powell told lawmakers that price pressures were expected to abate as the reopening broadens out and as supply constraints are resolved. With the labour market still deep in recovery mode, it is on that basis that the core of the Fed's FOMC is maintaining the view that it is appropriate to continue running asset purchases at the current pace of $120bn/mth.  

However, there are much more hawkish views on high inflation being taken by other G10 central banks, two of which  the Bank of Canada and Reserve Bank of New Zealand  held policy meetings this week. The BoC cited increased confidence in the domestic economic outlook for the second half of the year, with widening vaccination coverage set to see an easing of restrictions, as justification for a further tapering of its asset purchases, from $3bn to $2bn per week. But its forward guidance for rates to remain at the lower bound through to the second half of 2022 was retained. Going a step further was the RBNZ, with the surprise announcement coming from the Committee that its asset purchase program will be wound up by the end of next week as it assessed stimulus could be withdrawn with downside risks to the economic outlook having receded. On the back of this and following a stronger-than-expected rise in CPI inflation in Q2 to 3.3%Y/Y from 1.5% (vs 2.7% expected), rates markets have moved to price in around 50bps of hikes (2 rate hikes) by the end of the year. Another economy where inflation is running above the central bank's target is the UK. Annual CPI lifted from 2.1% to a near 3-year high of 2.5% (vs 2.2% expected) in June, driven by the reversal of sharp price falls from the depths of last year's initial lockdown, with prices for motor fuel, used cars, clothing and footwear and eating out on the rise. While the central view of the Bank of England is that the prevailing inflation dynamics have a transitory nature, speeches from two MPC members Ramsden and Saunders put forward cases for considering a near-term tapering of asset purchases. Further tension here came from a House of Lords report this week that was critical of the BoE's £895bn quantitive easing program. In the euro area, while June's finalised CPI readings at 1.9%Y/Y for the headline rate and 0.9%Y/Y on core are well up from the lows of the pandemic, the impulse is softer than in many other advanced economies. Given the recent adjustment to the European Central Bank's inflation mandate to a 2% symmetrical goal, this sets up an interesting meeting by the Governing Council next week, with President Christine Lagarde hinting that its forward guidance is in line for some tweaking. 

Wednesday, July 14, 2021

Australian employment rises 29.1k in June; Unemployment rate falls to a 10.5-year low

Australia's unemployment rate has fallen to a 10.5-year low of 4.9% just 11 months after it had hit a near 22-year high shortly after the onset of the pandemic. Employment continued to rise further above its pre-pandemic level, lifting by 29.1k in June to follow on from the very strong increase in May of 115.2k. However, hours worked fell sharply in the month reflecting the impact of the snap two-week lockdown in Victoria.

Labour Force Survey — June | By the numbers

  • Employment (on net) came in above the consensus estimate rising by 29.1k in June vs 20.0k expected. This added to the 115.2k surge in May. 
  • Australian unemployment is now at its lowest level since December 2010 after falling from 5.1% to 4.9% (vs 5.1% expected).
  • Labour force participation maintained its level from the month prior coming in at 66.2%. Meanwhile, the employment to population ratio lifted to a record high at 63.0%.  
  • Hours worked declined sharply with a 1.8% fall in June (6.8%yr), driven mainly by the impact of Victoria's recent lockdown as hours worked in the state plunged by 8.4%m/m. 


Labour Force Survey — June | The details

On the back of May's very strong rise in employment (115.2k), a further gain of 29.1k came through in June to outperform the consensus expectation (20.0k). This has elevated total employment to 1.2% above its pre-pandemic level.


For the third consecutive month, it was full-time work leading employment higher. Full-time employment lifted by 51.6k as part-time employment fell by 22.5k. The patchiness in part-time work of late reflects weakness around the Easter holiday period and the impact from the Victorian lockdown. Full-time employment is now 1.7% higher than its pre-pandemic level, while part-time employment (0.2%) is broadly in line with where it was in March 2020. 


Hours worked continued on their volatile path. Back in April hours worked declined by 0.7% as many Australians took leave around the Easter period before rebounding by 1.4% in May. Then in June, a snap lockdown in Victoria led to hours worked nationally falling by 1.8%, decelerating annual growth to 6.8% from 13.0%. In the month, both full-time (-1.6%) and part-time hours (-3.0%) declined.


This next chart highlights the impact that the Victorian lockdown had on hours worked nationally. Hours worked in Victoria plunged by 8.4% in June, which was the sharpest month-on-month fall seen in the state since the introduction of last year's national lockdown. Notwithstanding a 1.1% fall in hours worked in Queensland, if we exclude the impact of Victoria's lockdown, hours worked across the other 5 states lifted by 0.5% on the month prior. Going forward, hours worked will snapback in Victoria with the state reopening, but in New South Wales hours worked are set for a sizeable fall due to the lockdown in Sydney, which is now approaching its 4th week.  


The combination of rising employment and falling hours worked had varying effects on the measures of labour market spare capacity. With the participation rate holding steady at 66.2%, the growth in the labour force (7.1k) was comfortably outpaced by the rise in employment (29.1k). This drove the heads-based unemployment rate down from 5.1% to its lowest level in 10.5 years at 4.9%. But the loss of hours worked in the economy meant that rates of both underemployment (+0.5ppt to 7.9%) and underutilisation (+0.3ppt to 12.8%) backed up in the month. As alluded to above, the impact of the Sydney lockdown could well prompt further rises to these measures at the national level in July.  


Coming back to the states, the chart below shows the profiles for employment growth. Queensland came out on top in June (16.7k), with the state also outperforming in Q2 (41.7k) and over the past year (235.2k). Employment in New South Wales contracted in June (-9.2k) after a very strong rise in May (75.2k) and was only second to Queensland over the past year. While employment fell in Victoria (-9.2k), as has been the case throughout the pandemic period, the lockdown impact was much more severe on hours worked. Participation in Victoria was also driven sharply lower by the lockdown (-0.4ppt to 66.1%), which saw unemployment there decline (-0.3ppt to 4.4%) despite the fall in employment. Both Western Australia (12.6k) and Tasmania (2.6k) saw employment rise in June, but South Australia recorded a 4.5k fall. 


Labour Force Survey — June | Insights

The further rise in employment is an encouraging signal considering the strength of the increase in May, broadly remaining consistent with the very high levels on the indicators of labour demand. However, the impact of the Sydney lockdown has significantly increased uncertainty over the near-term outlook. It is probably best to wait and see how the situation plays out in Sydney for a little longer before drawing any firm conclusions. For now, a national unemployment rate with a 4 in front of it is the key takeaway. 

Preview: Labour Force Survey — June

Australia's June labour force update is due to come through at 11:30am (AEST) today. It will follow a remarkably strong set of outcomes in May where employment surged by 115.2k and the unemployment rate fell from 5.5% to 5.1% to be back at pre-pandemic levels. While forward-looking indicators continue to support a positive outlook, the resilience of the recovery in the labour market is set to be tested by the return to lockdowns across several capital cities following recent virus outbreaks. 

As it stands | Labour Force Survey

Employment in May printed at 115.2k  an outcome that was sharply higher than the consensus forecast (30.0k) and the top end of the range of estimates (45.0k) going into the report. It also gave further credibility to initial assessments that the 30.7k fall in employment in April was driven by seasonality around the Easter holiday period rather than the roll-off of the JobKeeper wage subsidy. 


May's employment surge was led by a 97.5k increase in full-time employment as part-time employment lifted by 17.7k, with the latter segment only partially rebounding from a 64.2k fall in April. All up, this brought employment to 13.125 million to stand 1.0% above its pre-pandemic level. 


The strength of May's employment outcome drove a significant decline in the unemployment rate from 5.5% to 5.1%, taking it back to the level that prevailed in Australia in February 2020. This came alongside a rebound in the labour force participation rate to 66.2% after it had slipped to 65.9% in April associated with the Easter holiday period. Broader measures of spare capacity continued to fall — underemployment down from 7.8% to 7.4% and underutilisation lowering from 13.3% to 12.5% — and are at levels last seen around 8 years ago. 


A return to more normal patterns of work saw hours worked rebounding sharply by 1.4% in May after a 0.7% fall in the month prior. Annual growth in hours worked firmed from 12.3% to 13.0%, with the base period going back to last year's national lockdown. Compared to their pre-pandemic levels, hours worked (2.9%) have seen a sharper recovery than employment (1.0%). 


Market expectations | Labour Force Survey

Consensus is set on employment slowing back to a 20.0k rise for June, though as has been the case throughout the pandemic period the band of estimates is again wide, ranging from -25.0k to 45.0k. Likely inducing volatility into today's report will be Melbourne's recent two-week lockdown that was in effect for much of the survey period. The ABS's high-frequency payrolls data clearly shows the impact on Victorian payrolls relative to the other states. National unemployment is forecast to remain at 5.1%  estimates are spread between 4.9% and 5.2% — based on the participation rate holding at 66.2%.  


What to watch | Labour Force Survey

The main question to be answered today is whether the labour market was able to build on May's successes amid the disruptions from the two-week lockdown in Melbourne. Insights from previous lockdowns indicate that the impact will be most evident in the change in hours worked. There could be a more noticeable impact on employment in the July report due to the more protracted lockdown occurring in Sydney, though the income and business cash flow support measures announced by the Federal Government earlier this week have attenuated some of that risk.