Independent Australian and global macro analysis

Friday, September 13, 2024

Macro (Re)view (13/9) | Fed decision to go down to the wire

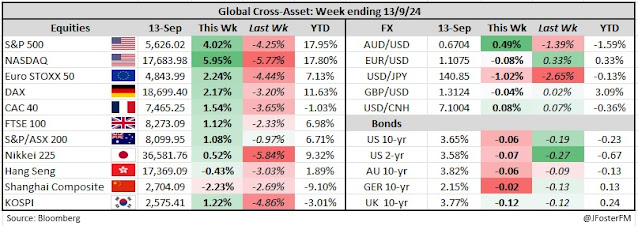
Equities rallied back from last week's declines, while lower US yields ahead of the start of the Fed's easing cycle at next week's meeting weighed on the dollar. Markets leaning towards a 50bps cut sent the benchmark 2-year Treasury yield to lows since mid-2022, with further downside in prospect in the event of a dovish Fed meeting. Other events of note next week include policy meetings for the BoJ (Fri) and BoE (Thu); US retail sales (Tue); inflation data in the UK and euro area (Wed); and Australia's monthly labour force report (Thu). 


Odds back in favour of a 50bps Fed cut 

The debate over whether the Fed will commence its easing cycle with either a 25 or a 50bps cut is set to continue all the way until the decision is handed down next week. Markets have swung back and forth as the incoming data has failed to give a clear steer. CPI data for August came in on consensus for the headline measure at 0.2%m/m and 2.5%y/y, down from 2.9%y/y previously, but a slight upside surprise for core inflation in the month at 0.3% (vs 0.2%) left the annual pace steady at 3.2%. This saw markets repricing for a 25bps cut; however, by the end of the week, the odds were back in favour of a 50bps move.  

Dovish bets were reinvigorated by media commentary and reports amid the Fed's pre-meeting blackout period. Influential former NY Fed President Dudley said he saw the case for a 50bps cut, while an article from the WSJ's top Fed watcher Timiraos outlined that the 25 vs 50bps debate was still very much live. My own view is that the developments the Fed has seen in the labour market of late, with rising unemployment and downward revisions to employment growth will lead the Fed to cut by 50bps.    

ECB cuts but remains cautious 

The ECB's decision to cut its key policy rate by 25bps to 3.5% had been fully discounted by markets going into this week's meeting. With growth slowing and inflation remaining on track to return to target in the back half of next year, the Governing Council continued the process of 'moderating the degree of monetary policy restriction'. Larger cuts (60bps) will go through to the ECB's other rates: Marginal Lending Facility to 3.9% and Main Refinancing Operations to 3.65%, changes that stem from a review tabled earlier in the year that recommended the ECB's corridor system of rates operate with narrower spreads (15bps from 50bps), effective from September.   

This was the second cut of the cycle and President Lagarde said during the post-meeting press conference that policy is 'pretty obviously (on) a declining path'. New staff projections retained the outlook for headline inflation to fall to 2.5% this year, 2.2% in 2025 and 1.9% in 2026; however, progress on core inflation was seen as less convincing due to services prices surprising on the upside recently. Those forecasts were revised up to 2.9% in 2024 (from 2.8%) and 2.3% in 2025 (from 2.2%). That leaves the Governing Council conveying an underlying sense of caution on the pace of rate cuts, reiterating a data-dependent stance and decisions being taken on a meeting-by-meeting basis. 

Market pricing leans towards another two rate cuts by year-end, a scenario that to be met would require the ECB to ease more aggressively than it has so far. That is not out of the question given downgrades to the growth outlook were made across the projection horizon: 0.8% in 2024 (from 0.9%), 1.3% in 2025 (from 1.4%) and 1.5% in 2026 (from 1.6%). Meanwhile, a Bloomberg article quoting ECB sources indicated a rate cut in October was not being ruled out. 

Inflation still the main game for the RBA 

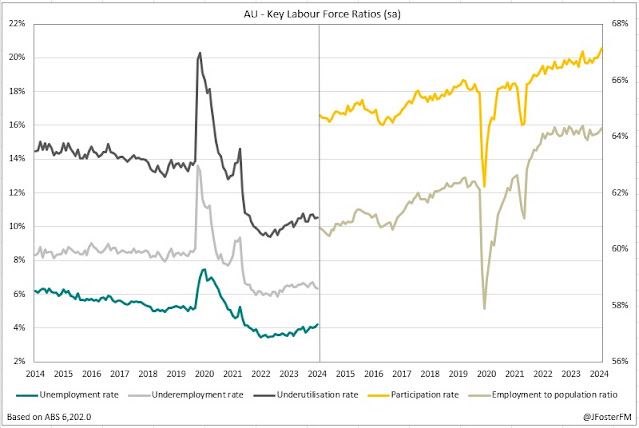
Insights on the Australian labour market in a speech from the RBA's Assistant Governor Hunter implied that inflation remains of much greater concern - a contrasting scenario to many of its central bank peers. Suggesting as much, Hunter highlighted that the labour market - though rebalancing - is still tight relative to the RBA's assessment of full employment, and the overall resilience of conditions amid the economic slowdown had surprised. The RBA forecasts the unemployment rate (4.2% as of July) to edge up to a peak of 4.4% over the coming year. As Hunter explained, a key part of that assessment is the view that vacancies can moderate from elevated levels to prevent a steeper rise in unemployment. While the RBA is wary of a more pessimistic scenario unfolding, it will need to see this emerging in the data - starting with next week's August labour force survey - to shift more of the policy focus to the employment side of the mandate. 

There was a potential warning light on this front as households highlighted some increased concern around the labour market in the Westpac-Melbourne Institute Index September report. This contributed to an easing of consumer sentiment (-0.5%) in the month, with the index (84.6) remaining in its deeply pessimistic range of the past couple of years. Meanwhile, the NAB Business Survey reported a softening in trading conditions and a weakening in confidence in August, both indicative of the subdued growth backdrop reported in last week's National Accounts for the June quarter.        

Friday, September 6, 2024

Macro (Re)view (6/9) | All options on the table for the Fed

Growth concerns returned this week to hit equity markets in a repeat of the episode from August. A lacklustre nonfarm payrolls in the US has left the door open for a frontloaded start to the cutting cycle from the Federal Reserve, driving a bear steeping of the Treasury curve on a sharp move lower in the 2-year benchmark yield. Rate cuts are the order of the day for global central banks, with the Bank of Canada easing by a further 25bps and the ECB expected to follow suit next week. By contrast, the RBA continues to remain hawkish.  


August payrolls fail to resolve the 25 or 50bps debate... 

Markets remain divided over whether the Fed will commence its easing cycle with a 25 or 50bps cut at the upcoming meeting on 17-18 September. The keenly awaited August report showed nonfarm payrolls increased by 142k, coming in light relative to the expected figure of 165k while revisions deducted a net 86k from employment over June and July. Although this raised unease that slowing employment reflects weakening growth, the unemployment rate fell back to 4.2% from 4.3% in the prior month as the participation rate remained at an unchanged 62.7%. Speaking post the payrolls release, Fed officials including Governor Waller and NY Fed President Williams endorsed the need to start cutting rates but gave no clear signs that a frontloaded 50bps cut was on the cards. 

.... while the ECB prepares to cut again

The ECB goes into next week's meeting with markets priced for a 25bps rate cut to be delivered by the Governing Council. Last week's inflation data provided the green light for the ECB to continue winding back restrictive policy following the initial cut in June, with headline inflation slowing to a 3-year low at 2.2%yr in August and the core rate easing to a slightly more elevated 2.8%yr pace. New forecasts to be published at next week's meeting will give the ECB the chance to update markets on its outlook for inflation and how it sees the path for rates evolving.   

No pivot from the RBA despite slow growth  

RBA Governor Bullock continued to push back against prospects for rate cuts in the near term as the effects of restrictive monetary policy saw Australian growth slow further in Q2. Real GDP growth came in at 0.2% in the June quarter, easing growth through the year to 1% - its slowest pace outside the pandemic period since the aftermath of the early 1990s downturn. The higher cost of living and increased mortgage repayments saw households reducing consumption in the quarter (-0.2%), most notably in discretionary categories (-1.1%). 

With finances squeezed, the household saving ratio remained at 0.6%, implying that over the first half of the year, households had been spending nearly all of their disposable income to meet their expenses. In addition to the decline in household consumption, weak outcomes for residential construction (0.1%q/q) and business investment (0.1%q/q) indicated that higher interest rates were weighing on the economy more broadly. Continued strength in public demand (0.8%q/q, 3.4%Y/Y) is playing a key role in providing countercyclical support to growth as private demand has slowed materially (0%q/q, 0.8%Y/Y). For more on Australia's Q2 GDP growth outcome, please see my In review feature article here with in-depth analysis and charts from the national accounts release. 

Speaking this week, Governor Bullock outlined that while the Board is still aiming to steer the economy along the narrow path - gradually returning inflation to the 2-3% target range while preserving the labour market - its focus remains on the inflation side of its mandate. Accordingly, Governor Bullock reaffirmed that the Board does not see the case to cut rates by year-end as is currently priced into markets. Until the RBA is confident that inflation is on track to return to target on a sustainable basis, Governor Bullock said that restrictive policy will be maintained. In other local developments this week, dwelling approvals rose by 10.4% in July (see here); housing finance accelerated by 3.9% (see here); and the trade surplus widened to $6bn (see here).

Thursday, September 5, 2024

Australian housing finance advances further in July

Australian housing finance lifted for the 6th consecutive month rising by a stronger-than-expected 3.9% in July (vs 1% forecast). Investor lending drove the headline increase with a 5.4% lift while owner-occupier commitments were up by 2.9%. Commitments have surged since early 2023 reflecting strong underlying demand for housing due to population growth and rising housing prices. Earlier in the week, CoreLogic reported that the national median housing price increased by 7.1% over the year to August rising through $800k. 


Housing finance commitments accelerated by 3.9% in July, rising to their highest level ($30.6bn) in 25 months. Over the past year, commitments have risen in value by 26.5% and are up 31.5% on the cycle low in January 2023 ($23.3bn). 


The owner-occupier segment saw lending commitments rise by 2.9% in the latest month to $18.9bn, an increase of 21.4% on a year ago. Within the segment, commitments to 'upgraders' (existing home owners) advanced by 4.1%; first home buyers edged up 0.8%; while construction-related lending was broadly flat (0.2%) as a rise in commitments to purchase newly finished dwellings (5.8%) was offset by a fall in lending for new home building (-3.2%). 


Details around underlying loan volumes were mixed, rising for upgraders (3%) and first home buyers (0.8%) but declining for construction-related purposes (-1.2%). 


Investor commitments saw a 5.4% rise come through in July bringing the level to $11.7bn - a touch below the record high from January 2022 ($11.8bn). From that peak, commitments went on to fall sharply through 2022 alongside the RBA's hiking cycle; however, the subsequent rebound has almost been as rapid - despite the cash rate having risen by 425bps. 

Australia's trade surplus widens to $6bn in July

Australia's trade surplus widened to $6bn in July - its highest level in 5 months - on the back of a rise in exports (0.7%) and softer imports (-0.8%). The July result defied expectations for a narrowing in the monthly surplus to $5bn from a downwardly revised $5.4bn in June. 


July's trade surplus came in at $6bn, up from $5.4bn in June but remains around its recent lows. Throughout 2024, the trade surplus has narrowed materially as lower commodity prices have weighed on export revenue, while import spending - boosted by inflation - has risen. For the 3 months to July, the trade surplus averaged $5.5bn, just above the $5bn low in May. 


Export revenue increased for the third month running with a 0.7% lift coming through in July to $43.8bn (-1.4%yr). The main driver was a 6% lift in rural goods - adding to June's 7.5% gain - as exports of meat (4.2%) and other rural products (12.4%) advanced. This was partially offset by an easing in non-rural goods (-0.4%) with exports of coal (-1.7%) and LNG (-4.5%) hit by lower prices. Iron ore exports (0.3%) were broadly flat in the month. 


Import spending weakened by 0.8% in July, declining for the first time since April to come in at $37.8bn (3.0%yr). This result was driven by a 3.7% fall in intermediate goods as the value of fuel imports slumped 7.6% alongside lower oil prices. This weakness was moderated by gains in consumption goods (1.6%) and capital goods (1.6%). 

Wednesday, September 4, 2024

In review: Australian Q2 GDP: Subdued growth continues

Momentum in the Australian economy remains subdued in the face of higher interest rates and the cumulative effects of cost-of-living pressures over the past couple of years. Real GDP growth was 0.2% in the June quarter - in line with expectations - expanding by just 0.4% through the first half of 2024. Year-ended growth softened from 1.3% to 1.0%, running below official estimates of trend growth (around 2.5%) for more than a year and at its slowest pace outside the Covid period since the recovery from the downturn in the early 1990s.


In the context of the strong rebound in population growth post the pandemic, underlying growth is weak with per capita GDP contracting for the 6th quarter in succession (-0.4%) to be down 1.5% through the year. 


Global headwinds have been a contributing factor to slowing growth in Australia. Most advanced economies offshore also saw subdued growth over the first half of the year - the US a notable exception - while China was impacted by flooding and heatwaves and ongoing weakness in the property sector. 


Domestically, the transmission of the RBA's tightening cycle is weighing on activity following the 425bps increase in the cash rate between May 2022 and November last year. Private demand is weak (0%q/q, 0.8%Y/Y) with higher interest rates restraining household spending and also weighing on residential construction and business investment. By contrast, growth in public demand is robust (0.8%q/q, 3.4%Y/Y) - a legacy from the pandemic - holding a sharper slowdown at bay.       


In the near term, a rebound in household real incomes holds the keys to unlocking stronger economic growth. Inflation, though still elevated to the RBA's 2-3% target range, is coming down and fiscal support via the Stage 3 tax cuts and cost-of-living support measures started to flow early in Q3. The prospect of lower interest rates - another element that would boost household spending - continues to be resisted by the RBA; however, this is on the horizon with the global easing cycle ramping up. 


— — 

National Accounts — Q2 | Expenditure: GDP (E) 0.1%q/q, 0.9%Y/Y


Household consumption (-0.2%q/q, 0.5%Y/Y) — With households increasingly feeling the effects of the higher cost of living and the RBA's hiking cycle, consumption contracted by 0.2% in the June quarter. Year-ended growth moderated from 1.2% to 0.5% - its weakest pace outside the Covid period since the global financial crisis of 2008/09.  


Major sporting and entertainment events boosted discretionary-related consumption Q1 (1.0%); however, that reversed in the June quarter as households started to cut back (-1.1%). The main categories in which this was evident were in travel -4.4%; hotels and restaurants -1.5%; new vehicles -2.6% and clothing and footwear -1.6%. By contrast, essentials-related consumption continued to rise (0.5%).     


Turning the focus to incomes, household disposable income increased by 0.9% in the quarter and 4.9% over the year. However, while easing, inflation eroded most of those gains, leaving real disposable income up just 0.1% in quarter-on-quarter terms and 0.5% year-on-year. Labour income is running at a strong pace (1.0%q/q, 6.2%Y/Y) reflecting the underlying resilience of the labour market but is being offset by bracket creep - tax payments rose 3.1%q/q and 6.6%Y/Y - highlighting the importance of the stage 3 tax cuts ahead in Q3. Given these crosscurrents, the household saving ratio was unchanged in the June quarter at a very low 0.6%. 


Dwelling investment (0.1%q/q, -3.0%Y/Y) — Although rapid population growth is underpinning strong demand for housing, residential construction activity was broadly flat in Q2 (0.1%) and contracted over the past year (-3.0%). Headwinds from higher interest rates, capacity constraints in skilled labour and materials - legacies of the pandemic - and increased insolvencies are all slowing the pace at which the sector working through what is an elevated housing pipeline. In Q2, new home building lifted by 0.6% but was still down 2.4% over the year. The volume of alteration work (-0.8%q/q) continues to retrace from the high levels seen during the pandemic falling by 3.9% in year-ended terms.  


Business investment (0.1%q/q, 2.2%Y/Y) — A broadly flat outcome in Q2 (0.1%) confirmed a loss of momentum in business investment over the first half of the year (-0.2%). Throughout 2023, business investment ran at an upbeat pace and was a major driver of economic growth. The momentum has turned with non-dwelling construction weakening over the first half (-3.2%), despite rising in Q2 (1%) as work on datacentres and mining projects commenced. Equipment investment saw a 1.6% fall in Q2 as firms delayed non-essential purchase decisions but still lifted by 0.9% across the first half.   


Public demand (0.8%q/q, 3.4%Y/Y) — Public demand lifted by a further 0.8% in the quarter, remaining a key countercyclical support to growth with private demand slowing. Over the past year, public demand has increased by 3.4%, directly contributing 1ppt to economic growth. In the June quarter, government expenditure (1.4%) rose at its fastest pace in a year on cost-of-living support measures, spending on major government programs (such as the NDIS) and public sector employment. This more than offset a slowdown in new investment (-2.2%) as transport and health projects being rolled out by state and local governments moved closer to completion.  


Public demand as a share of output continues to rise, now exceeding its highs seen during the pandemic when governments responded rapidly to the crisis with emergency fiscal support measures. 


Inventories (-0.3ppt in Q2, 0.7ppt yr) — Subtracted 0.3ppt from growth in the latest quarter but added 0.7ppt over the past year. A much smaller build-up in private non-farm inventories this quarter ($0.2bn) relative to Q1 ($3.0bn) cut 0.5ppt from GDP growth. This was moderated by a 0.3ppt contribution from public authorities inventories, which increased following a drawdown in the March quarter.


Net exports (0.2ppt in Q2, -1.2ppt yr) — The net exports component swung from a sizeable weight on activity in Q1 (-0.9ppt) to contribute a modest 0.2ppt to Q2 GDP. Over the past year, international trade has weighed heavily on economic growth as the post-pandemic rebound in exports has slowed (0.1%Y/Y) while imports, boosted by overseas travel, have continued to rise solidly (5.2%Y/Y).


Export volumes in the June quarter lifted by a modest 0.5% as a rise in services exports (5.6%) was largely offset by a decline in goods (-0.5%). Services exports remain supported by overseas tourists and students, though the post-pandemic recovery has mostly run its course by now. Goods exports were weighed by weakness in resources (-0.4%) on declines in shipments of coal (-1.1%) and LNG (-2.2%). 

After rising sharply in Q1 (6.1%), imports came in slightly lighter in the June quarter (-0.2%). A lift in services exports (0.5%) was underpinned by overseas travel to Europe during the northern summer. Meanwhile, a pullback in capital goods purchases by firms (-2.7%) drove a decline in goods imports (-0.4%). 

— — 

National Accounts — Q2 | Incomes: GDP (I) 0.2%q/q, 1.0%Y/Y 


The real GDP income estimate came in at 0.2% in the June quarter, easing from a 1.3% pace to 1% in year-ended terms. Taking a broad perspective, a key development for national income in the latest quarter was a sizeable 3.1% decline in the terms of trade. This was driven by a 3% fall in export prices in Q2 as coal and iron ore prices retraced, with import prices holding flat. 


As a result of the drag from the terms of trade, nominal GDP growth slowed sharply to a 0.2% rise in Q2, well down from Q1's 1.2% rise, with corporate profits also taking a hit.  


Private sector non-financial corporations profits fell by 2.8% in the quarter (-3.8%Y/Y), weighed by the weakness in the mining sector stemming from lower commodity prices. Another relevant factor that dragged on profits was the arts and recreation sector seeing profits slide after the boost major events provided in Q1. Financial corporations profits posted a further 1% rise in the quarter to be up 6.5% for the year, with higher interest rates boosting net interest margins. Gross mixed  income - small company profits - rose by 1.2%q/q (0.4%Y/Y). 


The picture around wage incomes remains solid, supported by resilient labour market conditions. Compensation of employees (CoE) posted a 0.9%q/q rise to be running at a 6.3%Y/Y pace. Within this, public sector CoE accelerated by 1.4% in the quarter, underpinned by new enterprise agreements coming into effect across Commonwealth and state government agencies, while increased employment lifted private sector CoE by 0.7% in Q2. 


Unit labour cost growth picked up in the June quarter alongside weak productivity outcomes. GDP per hour worked fell by 0.8% in Q2, seeing nominal unit labour costs rise by 1.2%q/q, up from a 0.4% rise Q1, while real unit labour costs saw a 1.3% rise. In annual terms, weakness in productivity growth at 0.4% underscores the RBA's caution around returning inflation to the 2-3% target band in a timely manner with unit labour costs at a 5.4% pace.   


— — 

National Accounts — Q2 | Production: GDP (P) 0.3%q/q, 1.0%Y/Y

The production estimate for GDP in the June quarter was 0.3% and 1.0% at an annual rate, down from 1.3%. Gross Value Added (GVA) by industries in the services sector outperformed their counterparts in goods-related areas.    


Looking at services industries, business services lifted by 0.5% overall for the quarter, up 1.7% across the year. Leading the way, telecommunications advanced (1.6%q/q) on increased software demand, while administration (0.8%q/q) was supported by labour hire activity. Household services posted a 0.3%q/q rise (1.7%Y/Y). The main contributors to this growth in Q2 were the education (0.6%) and health care industries (0.4%). This offset weakness in arts and recreation (-0.7%) from a reduction in major events and gambling activity and accommodation and food services (-0.3%) due to weaker demand at venues. 


Over in the goods industries, the goods production segment posted a 0.2%q/q increase. This was supported by rising demand for utilities (1.3%) as well as increased output from manufacturing (0.7%) and construction (0.5%). Goods distribution ticked up by 0.1% in the quarter. A 0.6% lift in the transport and postal sector - including increased overseas travel - was largely attenuated by weakness in retail trade (-0.3%) as households remained under budgetary pressures. 

Tuesday, September 3, 2024

Australian GDP 0.2% in Q2

Australian GDP growth matched expectations printing at 0.2% in the June quarter, the same growth rate as the previous two quarters. Growth through the year eased from 1.1% to 1%, the slowest pace outside the Covid period since the recovery from the early 1990s recession. Annual GDP has been running below most official estimates of trend or potential growth (around 2.5%) for more than a year now. Headwinds to growth have come from offshore - global slowdown and geopolitical tensions - and at home with higher interest rates and cost-of-living pressures biting. 


With the economy feeling the effects of higher interest rates, growth in private demand slowed to the point of drying up in Q2 (0%q/q, 0.8%Y/Y). Consumption was outright weak - real household spending fell by 0.2%q/q as discretionary-related purchases were cut back meaningfully (-1.1%) - while dwelling investment (0.1%q/q) and business investment (0.1%) were little more than flat. 


By contrast, public demand has been a counter-cyclical support to the economy (0.8%q/q, 3.4%Y/Y), with governments ramping up cost-of-living support measures and as the rollout of the vast pipeline of infrastructure projects has continued. 


Today's National Accounts should have limited RBA implications, with the Bank only recently forecasting growth to come in at 0.9%Y/Y in Q2. Policymakers at the central bank have countered calls for tighter policy to more quickly curb inflation by highlighting that per capita output (growth adjusted for population increase) is weak, something that continued in Q2 (-0.4%q/q, -1.5%Y/Y). 


However, the RBA has been resistant to market pricing for rate cuts to start later this year due to an expected gradual return of inflation to the 2-3% target band. Going back to the tenure of Governor Lowe and then carried on by current Governor Bullock, the RBA has consistently spoken of the need for productivity growth to rebound to deliver sustainable 2-3% inflation. Today's National Accounts showed a decline in productivity in Q2 (-0.8%q/q) - a largely unimportant statistic - however, the annual pace of 0.4% is probably weaker than the RBA would like to see with the pandemic moving further into the rear vision mirror. 


More to come. 


Monday, September 2, 2024

Australia Current Account -$10.7bn in Q2; net exports 0.2ppt

Australia's current account deficit increased to its widest since 2018 at $10.7bn in the June quarter (-1.6% of GDP), exceeding the median estimate for a $5.5bn deficit. Ahead of tomorrow's National Accounts, the ABS reported that net exports will contribute 0.2ppt to quarterly GDP growth, falling well short of expectations for a 0.6ppt add. Meanwhile, a 3.1% slide in the terms of trade weighed on national income in the quarter.   


The nation posted its widest current account deficit in 6 years printing at -$10.7bn in the June quarter from -$6.3bn in the March quarter (revised from -$4.9bn). The sizeable current account surpluses that Australia ran between mid-2019 to mid-2023 have given way to increasing deficits alongside the retracement in commodity prices as global growth slowed post the pandemic rebound. 


Driving the widening in the current account deficit was the underlying trade balance - the difference between export income and import spending - narrowing from $15.9bn to $12bn in Q2 - the smallest surplus seen since late 2018. Export revenue declined by 2.5% in the latest quarter to $161bn, driven by a 3% fall in prices with export volumes rising a little (0.5%). Import spending dipped modestly (-0.2%) to $149bn in Q2, reflecting a softening in volumes (-0.2%) as prices held steady (0%).  

A wider income deficit ($22.5bn from $21.9bn) also contributed to the larger current account deficit in Q2. 


With export volumes rising and import volumes falling, both of these movements add to economic growth within GDP calculations; however, the estimate from the ABS was just 0.2ppt compared to the 0.6ppt boost markets were anticipating. 


The other main takeaway is that the terms of trade - the ratio of export prices to import prices - recorded a sharp decline in the quarter, due to export prices falling and import prices holding flat - a dynamic that represents a drag on national income during Q2. 


Coming back to the details for trade volumes, the 0.5% rise in exports was driven entirely by services (5.6%) with goods contracting (-0.5%). Strength in services is mainly occurring in sectors such as tourism and education. Meanwhile, a fall in resources exports weighed on the goods component. This dynamic of services strength and goods weakness has been playing out since the unwinding of pandemic restrictions. But the rebound in services continues to slow and that has seen export volumes flatline in year-ended terms (0.1%).   


Import volumes were a touch lighter in Q2 (-0.2%) but still up 5.2% through the year. In Q2, services imports picked up (0.5%) alongside a rise in overseas travel (1.5%) through the northern hemisphere summer. Goods imports were down 0.4% in the quarter, driven by weakness in capital goods (-2.7%), which aligns with the contraction in equipment investment seen in last week's capex data.