Independent Australian and global macro analysis

Friday, March 29, 2019

Macro (Re)view (29/3) | Yield inversion signals weaker outlook

With relatively few headline events and data releases from a macro perspective on the calendar this week, the key focus in markets was around recent moves in yield curves from the US and across the globe. Last Friday, much weaker-than-expected surveys on business activity, most notably in manufacturing, in the US and Europe hit sentiment as markets anticipated the recent slowdown in economic growth to extended beyond the first quarter of the year. Concerns over the growth outlook were reflected in long-term bond yields declining below those at the front end of the curve as investors turned away from riskier asset classes.

The most widely followed curve by markets 
 the spread between the US 3-month and 10-year yields  has inverted, as shown in our chart of the week (below). Historically, inversion of the 3-month 10-year spread has been a reliable predictor of an upcoming recession in the US, with a lead time of roughly 12 to 18 months. Only time will tell if things turn out differently on this occasion — and there are sound arguments as to why signals from the yield curve may not be as predictive as they have been in the past — though markets are clearly wary of signs of late cycle weakness given the US is fast approaching its longest period of economic expansion on record. Meanwhile, the third and final estimate of US GDP growth in Q4 was this week trimmed to an annualised pace of 2.2%, down from 2.6% in Q3. Forward-looking PMI data indicates that GDP growth in Q1 is likely to come in around 2% on an annualised basis. 


Chart of the week

Brexit's state of bedlam showed few signs of abating this week. Firstly, MP's voted in favour of seizing control of the Brexit process for a day in an attempt to try and find a way out of the impasse. However, a series of non-binding indicative votes held on Wednesday only resulted in MP's voting against all 8 options put forward as alternatives to PM Theresa May's Brexit deal. PM May announced during the week that she would resign if her existing deal was passed by the parliament. On Friday (UK time), a parliamentary vote took place on the withdrawal agreement aspect (relating to the terms of the UK's exit from the EU and the Irish backstop) of the PM's Brexit proposal, which was defeated by a margin of 286 to 344 placing further uncertainty over the path forward. 

In Europe, European Central Bank (ECB) President Mario Draghi maintained that the policy stance would remain supportive, including "if necessary" possible measures aimed at preserving "the favourable implications of negative rates for the economy, while mitigating the side effects, if any". This is in relation to the ECB's deposit facility rate which is presently set at -0.4%. While this is aimed at incentivising lending to the real economy, 'side effects' refer to the potential impact on the profitability of the euro area's banks, as they effectively pay to maintain excess liquidity with the ECB on an overnight basis. Media reports had indicated that there had been discussions within the ECB around introducing a tiered deposit rate that would be aimed at reducing some of that cost faced by the banks amid a broader slowing in economic activity in the region. Such a move could be interpreted as indicating that negative rates were likely to remain part of the policy mix for a more extended period of time.  

Closer to home, the Reserve Bank of New Zealand was the latest central bank to move to a dovish stance by noting in its latest policy decision statement that "the more likely direction of our next (rates) move is down" with risks to the outlook having "shifted to the downside" in response to a weaker forecast for global growth and slowing domestic demand.    


— — 

The Australian data flow was decidedly second tier this week, as local markets focused on developments offshore. Government bond yields continued to slide with the 10 year reaching new lows below 1.8%, while the spread to the 2 year flattened out to its lowest since late 2010. Meanwhile, market expectations for Reserve Bank of Australia (RBA) easing firmed further this week; pricing on cash rate futures now indicates a 25 basis point (0.25%) cut is anticipated in August, with an additional 15 basis points of easing priced in by year-end. The consensus view of both markets and economists continues to shift towards the cash rate ending 2019 at 1.0% from its current level of 1.5%. The RBA Board meets next Tuesday and while no change to rates is expected, there will be close scrutiny of the Governor's statement for signs of a downgrade in their assessment of economic conditions and the outlook. 

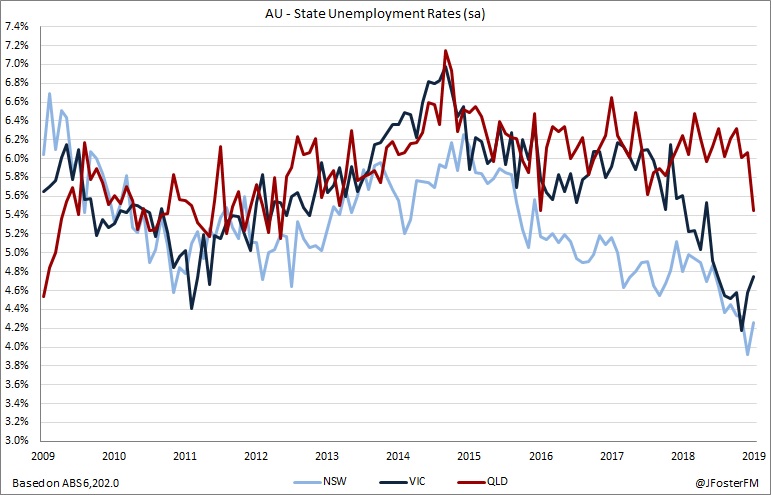
Staying with the RBA theme, Assistant Governor (Economic) Luci Ellis delivered a speech titled: What's Up (and Down) With Households? that provided a highly insightful perspective on the Bank's thinking around the household sector. It is very clear that the Bank has gained confidence from the strengthening in labour market conditions over the past year or so and highlighted the broad-based nature of employment growth. It has noted a gradual rise in wages growth — particularly in the private sector — citing tightening conditions, removal of wage freezes and increases to awards, though the unemployment rate was still some way off being consistent with a more material pick-up. 


The impact of slow income growth and expectations for that to persist has weighed on household consumption. The overall growth in households' income has been impacted by softness in labour income (wages and bonuses) as well as from non-labour sources (social assistance and income derived from rent, other investments and businesses). However, the key takeaway was that growth in taxes paid by households has over recent years been increasing by an above-average margin relative to the rate of growth in their gross income, with that situation becoming more pronounced over the past year. That analysis sets the scene ahead of next week's Federal Budget (April 2), in which fiscal policy through tax relief and infrastructure investment is likely to feature prominently. 


In terms of data, the ABS' Job Vacancies series showed a 1.4% rise over the quarter to February and by 9.9% through the year. While the pace of growth is slowing, it remains relatively solid and the total number of vacancies is at a record high, all of which appears to indicate that a near-term deterioration in labour market conditions is unlikely.


Private sector credit growth lifted by 0.3% in February, a slightly stronger-than-anticipated outcome, though the annual pace eased to 4.2% from 4.3%. Total credit growth for housing slowed to a 4.2% annual rate — its lowest on record dating back to 1977 — reflecting the impact of tight lending assessment criteria following the banking royal commission. Growth to the owner-occupier segment was 5.9%Y/Y and just 0.9%Y/Y to investors marking a new record low.    

Friday, March 22, 2019

Macro (Re)view (22/3) | Fed turns dovish; Australian data tension

Global markets were heavily focused on this week's policy meeting from the US Federal Reserve. The Committee left its key interest rate unchanged but surprised the markets by taking on a more dovish stance than had been expected, with slowing global growth and lingering uncertainties from trade and Brexit noted as risks to the outlook for the US economy. Those risks were downplayed by Fed Chair Jerome Powell at the associated press conference by describing the domestic economy as being "in a good place", though growth was expected to moderate to a "solid pace" this year from its "very strong pace of 2018".

The Committee members' median projection for GDP growth in 2019 was lowered to 2.1% from 2.3% and to 1.9% from 2.0% for 2020, while the outlook for the unemployment rate was also downgraded to 3.7% from 3.5% this year and to 3.8% from 3.6% for next year. Chair Powell commented that the updated projections "point to a modest slowdown, with overall conditions remaining favourable". Given that the fed funds rate is assessed to be around its neutral estimate, that in the Committee's view justified it being "patient in assessing the need for any change in the stance of policy". 


As a result, the median projection now points to rates being left on hold through the remainder of the year, removing its implied expectation for 2 rate increases in 2019 that were projected at its December meeting. The median projection for 1 rate increase in 2020 was retained. In basic terms, that points to the fed funds rate now reaching a midpoint of 2.6% in 2020, whereas in December the projection was at 3.1%. Completing its dovish turn, the Committee announced that it would reduce its balance sheet run-off from $30bn to $15bn per month starting in May, before reaching an end in September at a terminal value likely to "be a bit above $3.5 trillion" according to Chair Powell. Slowing the pace of run-off and maintaining the balance sheet at that level is intended to ensure ample liquidity remains in the system to prevent financial conditions from tightening through higher market interest rates.


In the UK, it was another dramatic week in Brexit developments. An expected third 'Meaningful vote' on PM Theresa May's Brexit deal was knocked back by the Speaker of the Commons under an obscure and historical convention of parliamentary procedure. PM May, then, on Wednesday wrote to European Council President Donald Tusk formally requesting an extension to Article 50 of the Brexit deadline set at March 29 until June 30, 2019. On Friday morning local time, President Tusk announced that the EU 27 leaders had agreed to an extension, though the details are somewhat complicated. If over the next week the UK Parliament is able to approve the existing Brexit proposal, the withdrawal will take place on May 22. However, if that approval is not forthcoming, the UK has until April 12 to outline to the EU how it plans to proceed. All scenarios remain open up until that new cliff-edge date of April 12 including; an exit with a deal, a no-deal exit, a long extension to the withdrawal date or effectively a cancelling of Brexit by revoking Article 50.


Given the persisting uncertainty, the latest policy meeting from Bank of England (BoE) held during the week saw rates on hold as expected, with commentary heavily focused around Brexit, highlighting that "the economic outlook will continue to depend significantly on the nature and timing of EU withdrawal". Regardless of the outcome, the BoE pointed to a weakening in confidence and in short-term activity, driven by reduced business investment, as the impacts on the economy from Brexit. However, it noted that a strong labour market had helped to moderate those headwinds. The BoE retained the line that its policy response to Brexit "will not be automatic and could be in either direction". 


— — —

Turning to the domestic focus over the week, the Reserve Bank of Australia's (RBA) March meeting minutes provided several points of interest. The key development was that the Board had identified 'tension' in the domestic data flow, specifically that the labour market had been improving despite slowing momentum in economic growth. The March meeting took place the day before Q4's National Accounts were released, where the Board had anticipated output growth to be "a little lower" than the 2.75% (year-on-year) that it had forecast in February's Statement on Monetary Policy". Q4's growth outcome of 2.3% was potentially below that guidance, though its expectation for "a markedly slower pace of growth in the second half of 2018 than in the first half" was confirmed.

In spite of slowing growth, due mainly to weakness in household consumption and residential construction, the minutes noted that forward-looking indicators had "pointed to further tightening in the labour market in the near term". How this situation plays out is key and as the Board later indicated, it will await further data before reaching a firm assessment given the uncertainties involved. For the moment, the Bank's guidance is 'neutral' by continuing to note that scenarios under which the cash rate could increase or decrease "were more evenly balanced than they had been over the preceding year". The Board, however, gave a clear indication that it will take a data dependent approach by noting that "members agreed that developments in the labour market were particularly important".

To that end, Thursday's Labour Force Survey for February was keenly anticipated by the markets, though it ultimately provided few clear signals — in either direction (see here for our full review). Employment lifted by a softer-than-expected 4,600 in the month on a seasonally-adjusted basis (vs median forecast for +15,000), but the national unemployment fell to its lowest level since June 2011 at 4.9%, as workforce participation declined. 

Given those conflicting signals, the trend series data perhaps offers a better guide. On that basis, both the unemployment (5.0%) and participation (65.6%) rates continued to remain unchanged from recent months, though monthly employment growth has softened recently, as shown in our chart of the week (below) to around 22,000 in the month. That level is still solid and above what is generally required to prevent the nation's unemployment rate from rising, but a continuation of that trend would likely change that situation and will only increase the importance of forward-looking indicators of labour market activity (such as vacancies and hiring intentions) for markets in the near-term.   


Chart of the week

The housing market is rarely far from focus and this week, there was a speech from the RBA's Michele Bullock (see here) which highlighted that the combination of household indebtedness and declining property prices over the past year were not regarded as significant enough to be raising financial stability concerns. Lastly, the ABS reported capital city property prices declined by 2.4% in Q4 and by -5.1% through the year (see our analysis here).  

Wednesday, March 20, 2019

Australia's unemployment rate sub-5% on lower participation

Australia's unemployment rate fell below 5% for the first time since mid-2011 in February, as participation in the labour force declined. Employment increased by a net 4,600 in the month to come in short of the consensus outcome, which last occurred in September 2018. Overall, the report provided no clear signals of deterioration in labour market conditions  now the key factor in Reserve Bank of Australia policy considerations going forward. 


Labour Force Survey — February | By the numbers
  • Employment increased by a net 4,600 in seasonally-adjusted terms, which was well below the meadian forecast for +15,000. January's intially reported 39,100 increase was revised down to +38,300.
  • The nation's unemployment rate declined to 4.9% from 5.0% (exp: 5.0%, prior: 5.0%). 
  • The underutilisation rate fell by 0.2ppt to 13.1%, while the underemployment rate held at 8.1%. 
  • The participation rate declined by 0.1ppt to 65.6% (exp: 65.7%)
  • Hours worked lifted by 0.2% in the month to 1.77bn and by 2.2% through the year (prior: +0.4%m/m, +3.3%Y/Y) 


Labour Force Survey — February | The details 

To the details, labour force participation declined from 65.7% to 65.6% in February on a seasonally-adjusted basis. That equated to 7,100 fewer people either in work or actively looking for work. With employment increasing by a net 4,600, that meant the total number of unemployed fell by 11,700, which explains the decline in the headline unemployment rate from 5.0% to 4.9% (at 2 decimal places from 5.03% to 4.95%). On a trend basis, the participation rate held at 65.7% for the 8th consecutive month and the unemployment rate at 5.0% has been unchanged for the past 3 months. 

The increase in employment of 4,600 was the net result of full-time work falling by 7,300 and part-time rising by 11,900. Through the year, employment growth lifted to 2.3% from 2.2%, though that was driven by a base effect (employment fell by 3,300 in February 2018). Employment growth slowed across the second half of 2018 from a very strong level, possibly in response to notably weaker activity in the economy, but still remains solid and comfortably outpaces growth in the labour force at around 1.7 to 1.8%.


Total hours worked lifted by 0.2% in the month and by 2.2% for the year, with growth looking to be on a mildly upward trend. When adjusted for the increase in employment, average hours worked per employee in the month was little changed in February (+0.1%) and over the year (-0.1%) at 138.7 hours. 


The underemployment rate remained at 8.1% but is still historically elevated indicating that there are many workers wanting more hours than they are currently receiving. The broader underutilisation measure (including the unemployed and underemployed) drifted down to 13.0% — its lowest since mid-2013. 


Turning to the state detail, there were some sizeable moves in unemployment rates but different from what has been reported over recent months. Unemployment in the 'major 2' increased; New South Wales +0.4ppt to 4.3% and Victoria +0.2ppt to 4.8%. That would be significant if that continued because those two states have driven national employment growth over the past year or so (see below).


Unemployment, however, declined in the other states; Queensland -0.7ppt to 5.4%, South Australia -0.6ppt to 5.7%, Western Australia -1ppt to 5.9% and Tasmania -0.5ppt to 6.5%. Though pleasing, single-month moves at the state level tend to be volatile so caution would be advisable.


Labour Force Survey — February | Insights

This was a highly anticipated release given the RBA's minutes from its March meeting highlighted that "(Board) members agreed that developments in the labour market were particularly important" in terms of its economic outlook. For the time being, there is little to suggest a deterioration in conditions has occurred, more like a softening, though the counter-argument is that labour market data are a measure that lags activity in the economy. Forward-looking indicators present risks to the employment outlook. The key consideration for markets is whether the RBA will wait for the data to confirm a potential weakening in the labour market before considering easing, or possibly look to take a more proactive stance. Given Tuesday's RBA minutes gave attention to 'tension' in the data — referring to resilient labour market conditions despite slowing economic growth that has also been experienced globally — it may lean towards the former. 

What to expect: Labour Force Survey -- February

Australia's labour market made a strong start to 2019, as January's Labour Force Survey came in stronger than expected to extend its robust finish to 2018. Today, the ABS is scheduled to release its Labour Force Survey for February at 11:30am (AEDT). Heightening the anticipation in markets for today's release, the Reserve Bank of Australia's March minutes (published on Tuesday) in discussing its economic outlook noted that "(Board) members agreed that developments in the labour market were particularly important". That provides the clearest indication of what the Bank's reaction function is likely to be over the months ahead. 


As it stands Labour Force Survey 

In January, employment increased by a net 39,100 in seasonally-adjusted terms, which far exceeded the market forecast for a 15,000 rise. This was the 4th consecutive month where the employment outcome had printed above the consensus figure. The underlying detail was volatile, with full-time rising by 65,400 and part-time falling by 26,300. 

The national unemployment rate remained at 5.0%, as the participation rate ticked up to 65.7% to sit a fraction below its record high. The highlight of the release was that the key measures of excess capacity declined; underemployment rate (workers who want more hours) -0.2ppt to 8.1% and the underutilisation rate (underemployed and unemployed) -0.1ppt to 13.1%.


Market expectations Labour Force Survey 

Today, the median market forecast compiled by Bloomberg Australia looks again for employment to rise by 15,000 in the month, with a range from -5,000 to +30,000. Based on that outcome, the unemployment rate is expected to remain at 5.0% and the participation rate to hold at 65.7%.  


What to look for Labour Force Survey 

It will be interesting to observe how the markets respond to any miss on expectations today. While January's survey was strong on the surface, it appeared markets were skeptical having since strengthened their expectations and brought forward the timing for RBA easing. This likely reflects a markedly slower growth outlook for the domestic economy. However, that view is complicated by the fact that the labour market remained resilient despite a notable deterioration in the domestic economy over the second half of 2018. This 'tension' gained focus in the RBA's March meeting minutes and is similar to the current experiences of other advanced economies.   

There are also technical factors to take into consideration, namely due to volatility in the data prompted by the seasonal impact of the peak holiday period around December and January. Using history as a guide, we can see from the chart (below) that employment outcomes in February can often differ significantly from the previous month. The strength in January's survey potentially points to downside risk to today's report, noting also there could some impact induced by 'sample rotation' with the outgoing group having stronger employment characteristics than the remaining groups in the sample.  


Given these uncertainties, it will likely take a succession of soft labour market reports to unsettle the RBA, particularly when considering the recent momentum in the labour market. As highlighted in the chart, below, as of January, employment growth on a 3-month annualised basis was tracking at around 3% and by around 2.8% on a 6-month annualised basis. That compares with a still solid pace of 2.2% in year-on-year terms. Notwithstanding, there are near-term risks around the employment outlook from softening leads in forward-looking labour market indicators, weakening signals from activity and consumer surveys and uncertainty around the federal election, though that could take some time to be reflected in the data.     

Monday, March 18, 2019

Australian property prices decline by 2.4% in Q4

Australian capital city dwelling prices declined by 2.4% on a weighted-average basis in the December quarter of 2018 according to the ABS' Residential Property Index released this morning. Prices declined by 5.1% compared to Q4 from a year earlier, corresponding with the peak in the headline index.

The detail across the capital cities in Q4 was;

  • Sydney -3.7% (-7.8% in year-on-year terms)
  • Melbourne -2.4% (-6.4%)
  • Brisbane -1.1% (-0.3%)
  • Adelaide +0.1% (+1.5%)
  • Perth -1.0% (-2.5%)
  • Hobart +0.7% (+9.6%)
  • Darwin -0.6% (-3.5%)
  • Canberra -0.2% (+1.8%)
  • Weighted-average of capitals -2.4% (-5.1%) 

Looking further into the headline figures, the chart (below) summarises the price changes for each capital for houses and units. 


The ABS' index is compiled using data provided by CoreLogic, who provide monthly updates on property price changes in its closely followed Home Value Index series. Earlier this month, CoreLogic released its report for February, which showed that prices declined by 0.7% nationally — a slightly softer pace relative to the declines recorded in December and January (see here).


The chart, below, tracks the values of the ABS' indexes from a historical perspective across each of the capitals since the beginning of the series in 2003 (click to expand). According to the weighted-average index, prices have declined for 4 consecutive quarters since peaking in Q4 of 2017. 


The index for Sydney recorded its 6th-straight quarterly decline (-3.7%) after reaching its peak in Q2 2017. In Melbourne, prices fell by 2.4% in Q4 to make it 4 consecutive quarterly declines from its peak in Q4 2017.

Prices declined in Q4 in Brisbane, Perth, Darwin and Canberra but at a more moderate rate compared to the 'major 2'. Adelaide prices were broadly flat. Hobart remains the standout market where prices lifted by a further 0.7% in the quarter and by a strong 9.6% across the year.  


The chart, below, shows the index values over time for houses in each of the capitals. House price declines over the past year in Sydney (-8.4%) and Melbourne (-7.6%) comfortably outpace the national decline (-5.5%).   


Lastly, this next chart shows the index values for capital city units. Sydney prices fell by 6.4% over the year, but only by a moderate 2.0% in Melbourne. The national decline was 4.2% for the year. In complete contrast, prices in Hobart continue to rise recording a sharp 11.3% increase over the past 12 months.  


The ABS also reported its estimate for the value of the nation's dwelling stock at $6.68tn as of Q4. That estimate is 2% lower than in Q3 and down by 3.9% in year-on-year terms. 


Friday, March 15, 2019

Macro (Re)view (15/3) | Australian sentiment weakens; Brexit turbulence

The week in Australia was highlighted by deteriorating reads in sentiment for both consumers and businesses. Westpac-Melbourne Institute's Consumer Sentiment Index declined by 4.8% in March to 98.8 from 103.8. A reading below 100 indicates that pessimists outnumber optimists. The catalyst behind the deterioration in sentiment to a 'cautiously pessimistic' reading was last week's softer-than-expected GDP growth figures from the National Accounts for Q4 (see our review here), which coincided with when the survey was 'in the field'. 

The accompanying report from Westpac's Senior Economist Matthew Hassan noted that more than one-third of the respondents surveyed had recalled noticing media reports last week pertaining to 'economic conditions' — the highest level of recall in 3 years — that had generally been perceived as weak, likely in reference to the reporting of a 'per capita recession'. The GDP figures and media reporting clearly impacted sentiment, with Westpac's analysis highlighting that the responses collected after the National Accounts were released fell by some 8% compared to those obtained pre-release.

Notably, consumers are becoming more risk averse with two-thirds of respondents nominating paying down debt, superannuation accounts, and bank deposits as the best place for their savings. The household saving ratio ticked up slightly in Q4's National Accounts, with the detail from this survey pointing to a further increase given that views towards family finances over the next 12 months and compared to a year ago have slumped to below long-run average levels. Increased saving, though coming off a very low base, would be a significant headwind for consumption growth.

Views towards the housing market remain mixed. Expectations for house prices fell to a new record low, with around 1 in 2 consumers anticipating prices in New South Wales and Victoria to fall over the next 12 months. However, falling house prices and weakening expectations continue to lift sentiment towards purchasing a dwelling, though Westpac's analysis noted that affordability was still likely to be a relevant concern.

The National Australia Bank's (NAB) Business Survey for February showed a weakening in both conditions and confidence to below-average levels. The business conditions index fell by 3 points to a reading of +4, with declines for the sub-components of profitability (-4 points to +1) and trading (-2 points to +8). However, the positive was that the employment index remained steady at +5, with NAB economists indicating that this was consistent with employment growth of around 19,000 jobs per month, which while lower than in 2018 would be sufficient in preventing the nation's unemployment rate from rising. Meanwhile, business confidence is still assessed as positive, though it deteriorated over the second half of 2018 and now into 2019.  

Also of significance was that the aggregate capacity utilisation measure, which can provide an insight into firms' current output and future demand for labour and capital, continued its easing trend that was noticeable over the second half of 2018 and now sits a touch below its average level. This points to risks around the outlook for employment growth and business investment.


It appears that the weakening in sentiment was not only limited to consumers and businesses. As our chart of the week shows, the yield on Australian 10-year Commonwealth Government Bonds fell to a 2½-year low this week, which takes it to around its level from mid-2016 when the Reserve Bank of Australia (RBA) was lowering its cash rate. Though yield movements can be driven by a broad array of factors, the decline since the turn of the year has been influenced by a deterioration in market sentiment for the outlook in Australia in line with the 'bringing forward' and firming of expectations for RBA rate cuts.   


Chart of the week

The week's other main data release was January's update for housing finance (read our analysis here). Both loan approvals to owner-occupiers and the total value of lending commitments continued to contract in the month as tight credit conditions and declining property prices weigh on demand. The contraction has been sharpest in the investor segment with lending at its lowest level since late 2011 and down by nearly 30% over the year compared to a 17% decline from owner-occupiers. 

— — —

Looking overseas, it was another turbulent week regarding Brexit, though developments landed largely as markets had expected them to with the House of Commons voting in favour of extending the Article 50 period — in effect a delay to the March 29 withdrawal date, though that still requires the unanimous approval of the European Union (EU). The length of that delay is yet another source of uncertainty; it could be until June 30 if MP's agree to a Brexit deal by March 20, but failing that it could last much longer — potentially by up to a year according to media reports quoting EU President Donald Tusk — in order to allow the UK time to re-work its strategy and to garner the necessary level of support to reach a consensus. 

To recap events from earlier in the week, PM Theresa May's Brexit deal was voted down by the House at its second 'Meaningful vote', this time by a margin of 391 to 242. The following day, MP's rejected the notion of the UK withdrawing from the EU under a no-deal scenario, by 312 to 308 in a non-binding vote. Brexit will remain in the headlines next week with EU leaders meeting for a summit next Thursday, the day after the March 20 date specified as the deadline for the UK parliament to reach an agreement before moving towards gaining an extension.


In the US, the data flow this week was mostly positive with retail sales, durable goods orders and construction spending for January all coming in stronger than expected. However, GDP growth for Q1 appears likely to be soft, with the Atlanta Fed's GDPNow model currently estimating output growth of 0.4% in the quarter. This outcome has the annualised pace of growth on track to slow by around 1ppt to 1.6%. Meanwhile, February's Consumer Price Index was consistent with muted inflationary pressures as per the Federal Reserve's description. Annual inflation on a headline and core basis slowed by 0.1ppt to 1.5% and 2.1% respectively. 


The data highlight from Europe this week was industrial production for January lifting by a sharp 1.4%, albeit coming after notable declines in the preceding two months. The underlying detail showed that production in Italy and France increased strongly in the month, though in Germany declined by 0.9% having now fallen in 4 of the past 6 months. Also, inflation remained soft in February as the core measure eased to 1.0%Y/Y while a lift in energy prices saw the headline read ticking up to 1.5%. 

Markets were boosted late this week when China's Premier Li reaffirmed that authorities in Beijing will provide support the domestic economy against the headwinds from a slowing outlook and trade tensions. The measures to be implemented will include tax cuts and infrastructure investment, with further reductions in banks' reserve requirements also likely. Last week, Beijing announced a lower growth target for 2019 of 6 to 6.5% from 'around 6.5%'. 


Tuesday, March 12, 2019

Australian housing finance approvals weaken in January

Australian housing finance approvals to owner-occupiers declined for the third consecutive month in January, while the value of commitments made to investors posted a sixth-straight monthly fall.

Housing Finance — January | By the numbers

  • Housing finance approvals to owner-occupiers (excluding refinancing) fell by 1.2% in January to 31,801. The market forecast was for a 2% decline (prior revised: -8.0%m/m from -8.2%). Approvals have fallen by 14.7% through the year (prior rev: -14.0%Y/Y).
  • The total value of housing finance commitments (excluding refinancing) fell by 2.1% in the month to $A17.12bnbn — its lowest level since April 2013 — with the annual decline at -20.6% (prior rev: -19.3%). 
  • The value of commitments to owner-occupiers (excluding refinancing) fell by 1.3% in the month to $12.45bn — its weakest since May 2015 — to be down by 17.1% over the year. 
  • Investment commitments (excluding refinancing) in value terms fell by 4.1% in January to $4.67bn — its lowest since October 2011 — to take the annual decline to 28.6%. 


Housing Finance — January | The details 

Housing finance commitments continue to deteriorate both in terms of approvals and value. For clarification, the ABS refers to a housing finance commitment as a firm offer from a financial institution to provide finance to which the borrower has accepted. The commitment needs to have been approved by the lender and the borrower to have been issued with the loan contract.

The total value of housing finance commitments excluding refinancing arrangements made during January fell by 2.1% (or $372.1m) to $17.12bn. By segment, commitments to investor borrowers tumbled by 4.1% (-$202m) and owner-occupier commitments contracted by 1.3% (-$170.1m). Commitments made to owner-occupiers for alterations and additions were down by 26.4% in the month to $245.1m.  

The total value of refinancing fell by 3.9% ($328.6m) to $8.188bn, which included a 4.3% fall (-$254m) from owner-occupiers and a 2.9% decline (-$74.6m) from investors. Click on the charts to expand.  


By approvals — measuring the number of approvals written — total commitments to owner-occupiers excluding refinancing fell by 1.2% in January to 31,801. Within this figure, approvals to purchase established dwellings fell by 0.6%, while construction-related approvals were down overall by 3.0%; with approvals to purchase newly constructed dwellings -9.5% and approvals for construction -0.2%. 

The ABS does not provide approvals detail for investment commitments. 


The state-level detail showed that approvals to owner-occupiers were broadly weak in January with; New South Wales -4.9%, Victoria +0.4%, Queensland -2.4%, South Australia -0.7%, Western Australia -0.7% and Tasmania +2.4%. 


The underlying detail highlighted that the weakness was led mostly by non-first home buyers, in particular in New South Wales (-6.4%), Queensland (-4.5%) and Western Australia (-2.3%).  


Approvals to first home buyers were broadly flat (-0.3%) on a national basis in January. However, New South Wales (-4.4%) was the only area of weakness with gains for all other states; Victoria +1.3%, Queensland +5.3%, South Australia +2.6%, Western Australia +0.7% and Tasmania +1.3%. 


From a value perspective, commitments to owner-occupiers excluding refinancing declined in every state with the exception of Queensland (+2.3%). The detail was; New South Wales -2.2%, Victoria -0.6%, South Australia -0.7%, Western Australia -0.2% and Tasmania -1.9%. 


Meanwhile, the value of investment commitments continues to tumble recording a 4.1% fall in January across the nation, which increased the annual decline to -28.6%. In January alone the details were; New South Wales -6.1%, Victoria -1.5%, Queensland -3.3%, South Australia -2.1%, Western Australia -2.2% and Tasmania -13.0%. 


As regular readers would be aware, the ABS now publishes housing finance data in the new Lending to households and businesses series. To stay across the greatly expanded level of detail now available through this new series, we have compiled all the key details into this summary table, below.


Housing Finance — January | Insights 

This update showed a continuing deterioration in housing finance, though it is worth exercising caution when analysing January's figures due to seasonal impacts. Activity for both owner-occupiers was not as negative as expected in this release, though the deterioration on the investor side showed few signs of stabilising. The headwinds from tight credit standards, declining property prices, and uncertainty regarding the upcoming federal election appear to remain strong.  

Friday, March 8, 2019

Macro (Re)view (8/3) | Soft Australian GDP growth; ECB shifts dovish

This week's highlight in Australia was the release of National Accounts and associated GDP growth figures for the December quarter (Q4). Output growth in the domestic economy was 0.2% in the quarter and 2.3% in year-on-year terms, with both slower than the expected outcomes for 0.3% and 2.5% (for a full review see here). Taken with Q3's outturns of 0.3% in the quarter and 2.7% for the year, there was a notable loss of momentum in activity over the second half of 2018. Activity was quite robust in the first half of the year annualising at around 4% compared to around 1% for the second half.

The two main factors behind that analysis were slowing growth in households' spending on goods and services and activity in residential construction turning over. Household consumption, which accounts for a little above 50% of the domestic economy, was soft in Q4 lifting by 0.4% and by 2.0% through the year — its slowest annual rate in 5½ years. Slowing consumption growth indicates that households are being constrained by weak income growth with saving having declined over recent years to a very low level, notwithstanding an uptick in Q4. Added to the mix were concerns around wealth effects from declining property prices and volatile equity markets during the quarter. Residential construction showed signs of weakness in Q3 that deepened towards the end of the year. Activity looks to be past the peak with new construction (-3.6%) and alterations (-3.1%) declining sharply in Q4 and fits broadly with the deterioration in building approvals that occurred over the second half of 2018. 


While 2018 was a year of two halves for the domestic economy, it was also a year of two sides with growth in private and public sector demand diverging, as shown in our chart of the week, below. Public demand lifted sharply in 2018 driven by healthcare spending and infrastructure investment and was the leading contributor to economic growth over the year. In contrast, private demand slowed in response to broad-based softness from households, residential construction, and business investment.    

Chart of the week

The soft growth outcome resulted in financial markets firming expectations for the Reserve Bank of Australia (RBA) to cut the cash rate. Markets are now fully priced for a 0.25% rate cut in September — in the hours before the GDP data was released the expectation was for a cut in February 2020 — and place the chance of a follow-up cut in early 2020 as a 50/50 prospect. Meanwhile, market economists' expectations are shifting towards 2 rate cuts this year as consensus.

In other events in Australia this week, the RBA remained upbeat at its monthly policy meeting (reviewed here) and the following day Governor Philip Lowe delivered a very timely speech on the state of the housing market and its impacts on the broader economy (read here). In short, Governor Lowe outlined his view that it is the expectation for weak income growth, in line with the experience from recent years, that is weighing on household consumption with a negative wealth impact from falling property prices only a marginal influence. 

On the data front, there was a range of updates out for January. Building approvals lifted by more than expected in the month (analysis here), retail sales made a soft start to 2019 (see here) and Australia posted a near-record monthly trade surplus (covered here).  

— — —

From a global perspective, the major development this week was the European Central Bank's (ECB) shift to an ultra-dovish policy stance. In a move that surprised the markets, the ECB's Governing Council shifted its forward guidance on key interest rates — it now anticipates to remain on hold through to at least the end of 2019 where it had previously nominated the northern summer of this year — and announced a new round of target long-term refinancing operations — named 'TLTRO-III' — which will provide the euro area banking sector with access to a source of funding at cheaper and more favouable terms than in financial markets and incentivises lending to households and businesses.

Both the change in forward guidance and TLTRO-III had been foreshadowed by the Governing Council in their minutes from their January meeting. However, the timing of the announcement was somewhat earlier than the markets had been expecting, with the ECB looking to signal a proactive stance amid a period of slowing economic growth and to ward off a potential tightening in financial conditions due to more than 700 billion in funding obtained through earlier rounds of TLTRO due to be repaid by the banks in 2020 and 2021. TLTRO-III will start in September this year and end in March 2021, though full details are yet to be announced. 

At the accompanying press conference, ECB President Mario Draghi outlined that the change in policy was necessitated by a "definite worsening in the projections", with the Bank lowering its forecasts for GDP growth in 2019 from 1.7% to 1.1% and in 2020 from 1.7% to 1.6%. Just hours before the announcement, GDP growth in Q4 posted a softer-than-expected outturn at 0.2% for the quarter and 1.1% over the year (see here). The factors mentioned by President Draghi as weighing on the outlook were; slowing global trade activity, particularly in China, a potential slowdown in the US, vulnerabilities in emerging markets and a general loss of confidence due to political tensions in "trade discussions" as well as issues pertaining specifically to the euro area — namely lower output in Germany's auto sector and political uncertainty in Italy. 

Previously, the ECB was taking a wait-and-see approach to these uncertainties unsure if they would be temporary or signs of something longer lasting. The change in forecasts and policy changes point to the latter, with the ECB looking to underpin growth against uncertainties that are mostly external to the euro area while still assessing the risks to the outlook as "tilted to the downside".