Independent Australian and global macro analysis

Wednesday, January 30, 2019

Australian inflation remains below target in Q4

Australia's Consumer Price Index (CPI) came in around market expectations in Q4, though economy-wide pricing pressures remain soft. Core inflation, which excludes price changes in volatile items, printed at 1.77% in year-on-year terms in Q4 and has remained persistently below the 2-3% range targeted by the Reserve Bank of Australia (RBA) since 2015, largely reflecting the impact of slow wages growth associated with an elevated level of spare capacity in the nation's labour market. Today's outcome was in line with the RBA's forecast for Q4, with the Bank expecting inflation to rise gradually within target over the next couple of years. The RBA is scheduled to release updated growth and inflation forecasts next week. 

Consumer Price Index — Q4 | By the numbers 
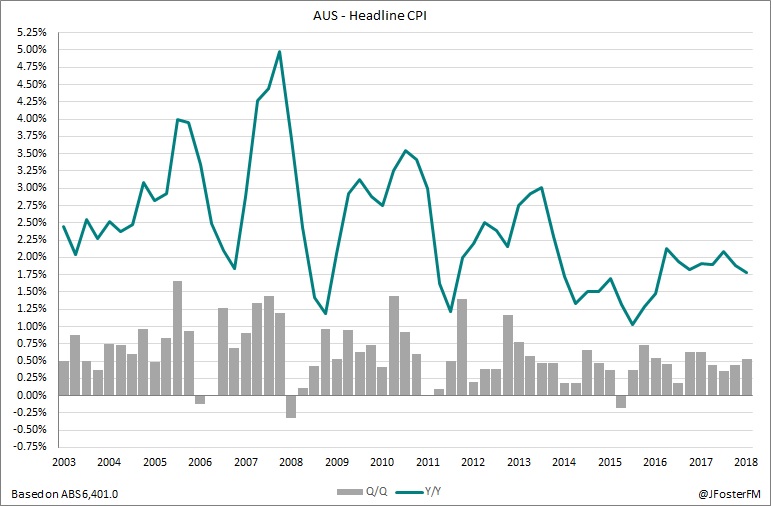
  • Headline inflation was 0.5% in Q4, ahead of the market forecast for 0.4% and the first upside result in 2 years (prior: 0.4%). 
  • Annual headline inflation at 1.8% was also ahead of the median forecast for 1.7%, but down from the 1.9% pace in Q3. 
  • Core inflation (average of the trimmed mean and weighted median measures) was 0.4% in Q4, compared to the market forecast for 0.45% (prior rev 0.37% from 0.32%)
  • Annual core inflation was 1.77%, in line with expectations for 1.75% (prior rev 1.8% from 1.75%)     


Consumer Price Index — Q4 | The details 

Looking across the categories, the quarterly and annual price changes are shown in the chart, below (click to expand). The alcohol and tobacco group saw a 3.2% rise in the quarter (6.8%Y/Y), with tobacco prices up by a sharp 9.4% in Q4, following a 12.5% increase in the federal excise tax. 

Recreation and culture lifted by 1.1% (1.7%Y/Y) following a 6.2% increase in the cost of domestic holiday travel, which as the ABS highlighted coincided with the October school holiday period and the lead up to the peak season over summer. 

Food and non-alcoholic beverages posted a 0.9% rise in Q4 (1.5%Y/Y), which incorporated seasonal impacts in fruit prices (+5%q/q), while meat prices (+1.6%q/q) lifted in response in drought conditions. 

In the key housing category, the quarterly rise of 0.2% was another soft outcome (1.5%Y/Y). There were subdued increases for both rents (+0.2%) and new dwelling purchases by owner-occupiers (+0.4%).   

The main drag on prices in Q4 was from a 0.7% fall from the transport group (2.8%Y/Y), which mostly reflected weaker global oil prices flowing through to petrol prices declining by 2.5% in the quarter.

Cyclical effects reducing out-of-pocket expenses for pharmaceuticals under the Federal government's Pharmaceutical Benefits Scheme saw the health group decline by 0.4% in the quarter (3.3%Y/Y).

Clothing and footwear eased by 0.2% (-0.7%Y/Y), which followed increases in the previous two quarters are a lengthy period of 6 consecutively quarterly declines. The intensity of retail competition and widespread discounting have been key factors in pricing weakness. This has also impacted furnishings and household equipment, though prices in these areas were firmer in Q4.


The contributions of the groups to the quarterly headline CPI result are shown in the chart, below. 


Overall, inflation continues to be driven by areas in which prices are impacted by aspects of government policy such as alcohol and tobacco, utilities, health, education, and property rates. The chart, below, highlights that inflationary sources from the private sector as measured by market goods and services ex-volatile items continue to lag the broader CPI index. However, market-based sources jumped by 0.7% Q4 to 1.5%Y/Y — its fastest annual pace in 3 years — after being stuck at 1.1%Y/Y for the past 4 quarters.       


Inflation also continues to be driven largely by domestic-based factors. Non-tradables lifted by 0.9% in Q4 (2.4%Y/Y) reflecting the increases in tobacco costs and in domestic holiday travel. Tradables — goods and services where prices are determined on global markets — fell by 0.3% in the quarter (0.6%Y/Y) following the weakness in petrol prices and also in audio, visual and computer equipment. 


Consumer Price Index — Q4 | Insights 

Today's data continued to show a soft inflationary pulse in the domestic economy and in that sense it was broadly consistent with the CPI reports from recent quarters. Inflation continues to be driven mostly by areas impacted by government policy, and in particular, tobacco remains a key driver. Sources of inflation remain subdued in housing and in clothing and footwear, though household goods have firmed as a possible response to a weaker Australian dollar. Household services have also been weakened by changes to child care subsidies. The RBA forecasts a gradual lift in inflation over the next couple of years in response to a tightening in the labour market and given that Q4's data was broadly in line with their expectations, next week's updated forecasts are not likely to be revised too significantly from an inflationary perspective. 

Friday, January 25, 2019

Weekly note (25/1) | Slower growth as global risks rise

An outlook for slower economic growth due to rising risks from an array global uncertainties was the key theme in markets this week. While this already the base case for markets in response to slowing momentum in forward-looking indicators of activity and in weaker-than-expected incoming economic data, policymakers and authorities have increasingly shifted towards the market in this assessment.   

This week, the International Monetary Fund (IMF) lowered their forecast for global economic growth in 2019 from 3.7% to 3.5% and from 3.7% to 3.6% in 2020, citing factors from US-China trade tensions, tighter financial conditions, and political uncertainty. There were few signals as to how and for how long these uncertainties might play out during this week's World Economic Forum in Davos, with President's Trump, Xi and Macron and UK Prime Minister Theresa May notable absentees all facing more immediate concerns back at home. 

The slowing in the IMF's global growth outlook mostly referenced deteriorating conditions in the euro area. Germany, the largest economy in the region, has been impacted by a weakening in production, particularly from its blue-chip auto sector in response to recent emissions targets for new cars set by the European Union, and by trade uncertainties. Italy's economy is also weighing on the outlook due to political uncertainty and from the financial risks posed by its heavy level of national debt.

Remaining with Europe, the latest policy meeting of the European Central Bank (ECB) held during the week described the risks to the outlook as having "moved to the downside" compared to the assessment from December of "broadly balanced" but "moving to the downside"; a subtle but clear shift in the assessment of the growth outlook. ECB President Mario Draghi was clear that the Governing Council did not discuss policy options at this meeting and will be attempting to gain further clarity over its assessment of the outlook ahead of the March meeting where it will publish its updated forecasts. For now, the Governing Council's underlying assessment is that despite a near-term expectation for a weakening, the growth outlook is underpinned by favourable financial conditions, a strengthening labour market leading to stronger wages growth and an ongoing but somewhat slower expansion in the global economy. 

Developments in China were also of significance this week. Growth in China's economy slowed from 6.5% to 6.4% over the year to the December quarter, its slowest expansion since the global financial crisis around a decade ago, while growth over the calendar year was 6.6%. Chinese officials had targeted growth of 6.5% in 2018. The mild deceleration in growth comes amidst headwinds from trade tensions, a softer global economy and also the impact of longer-term structural reforms, which aim to set growth on a more sustainable path by addressing factors such as financial stability risks and reducing excess industrial capacity to improve production quality and environmental outcomes. Policy measures to help support growth include reductions to banks' reserve requirements to boost liquidity, tax cuts and infrastructure investment. 

The data flow was restricted in the US again this week, however; US President Trump as of Saturday morning announced a temporary deal had been reached to reopen the government for 3 weeks without securing border wall funding from the Democrats. The agreement comes after a 35-day partial shutdown of US government agencies.  


— — —

Signs of a slowing growth outlook were also evident in Australia this week. Westpac-Melbourne Institute's Leading Index fell to a reading of -0.27% in December from +0.42%, which provides an indication for growth in the domestic economy to slow below its potential pace of around 2.75%Y/Y over the next three to nine months. In Q3, output growth slowed from 3.1% in annual terms to an around-trend pace of 2.8%.      

The Leading Index reflects changes in a range of economic and financial market data points, with the deterioration in December pointing to headwinds for the domestic economy, which according to Westpac's Chief Economist Bill Evans include; a negative wealth impact on households' balance sheets from declining property prices, slowing residential construction activity and lower employment growth and investment from the business sector due to political uncertainty and heightened volatility in markets.


The Reserve Bank of Australia (RBA) next meets on February 5, which will be keenly anticipated given that much has changed globally since the Board last met in December. Over the summer, communication from other major central banks  including in the US, Europe, UK and Japan  has acknowledged rising uncertainties in the global economy and the potential headwinds to the growth outlook. 


According to the RBA's most recent forecasts, growth in the domestic economy is anticipated to increase at an above-trend pace of 3.5% in 2018 and by 3.25% in 2019, while its guidance is that "... the next move in the cash rate was more likely to be an increase than a decrease, but that there was no strong case for a near-term adjustment in monetary policy". Financial markets have continued to price out expectations for a rate increase over the next 18 months and will be looking to the Governor's statement at the February meeting for signs of a shift from the Board in their assessment of conditions both at home and abroad. 


Against a softening outlook, the key data event of the week showed ongoing strength in Australia's labour market. For the third consecutive month, employment posted a stronger-than-forecast result with a 21,600 increase in December, while the nation's unemployment rate lowered from 5.1% to 5.0% (see our full analysis here). 


In 2018, Australia's labour market performed stronger than anticipated as employment increased by 268,600. As highlighted by our chart of the week, the momentum was maintained towards the back end of the year, with employment increasing by 87,300 over Q4, which was an outperformance of 29,300 relative to market expectations. 


Chart of the week

Over the near term, the outlook for the labour market is supportive given that employment growth is tracking at a robust 2.1% annual pace and ahead of growth in the working-age population (around 1.7%Y/Y). However, factors that could slow the pace of employment growth and place upward pressure on the nation's unemployment rate over 2019 are a likely downturn in residential construction activity and increasing uncertainty from the upcoming federal election and from global developments. 

Wednesday, January 23, 2019

Australia's labour market remains stronger than expected

Australia's labour market posted a stronger-than-expected rise in employment in December as the nation's unemployment rate declined to its lowest level mid-2011. Despite a deterioration in other economic indicators recently, labour market conditions remain strong and will be a key support to the household sector, though the pace of wages growth remains low.


Labour Force Survey — December | By the numbers
  • Total employment increased by 21,600 in December, outpacing an expected rise of 18,000 (prior revised: 39,000 from 37,000)
  • The unemployment rate fell by 0.1ppt to 5.0%, which was an upside surprise to the market expectation for no change from 5.1% (unrevised from the previous month)
  • Measures of spare capacity decreased in December; underutilisation rate fell by 0.2ppt to 13.3%, and the underemployment rate declined by 0.1ppt to 8.4%
  • The participation rate fell by 0.1ppt to 65.6%, against an expectation for it to hold at 65.7% (unrevised)
  • Hours worked were a fraction higher in December, rising by 0.1% to 1.759bn hours (+1.5%Y/Y). (Prior revised: -0.3%m/m, +1.1%Y/Y) 


Labour Force Survey — December | The details 

Analysis of December's data shows that the rise in employment of 21,600 came entirely from the part-time category, which increased by 24,600, while full-time work declined by 3,000. In Q4, total employment lifted by 87,300 led by part-time at 58,500 compared to 28,800 gain in full-time. However, in 2018, total employment increased by a solid but not spectacular 268,600, which was driven by full-time at 162,000, with part-time adding 106,600.  

Australia's labour force increased marginally by around 7,500 in December, which equated to a decline in the nation's participation rate of 0.1ppt to 65.6%. This followed a large increase of 49,900 in the previous month that saw the participation rate jump by 0.2ppt to 65.7%. 

With the 21,600 gain in employment outpacing the 7,500 new entrants to the labour force, the total of unemployed fell by 14,100 to 666,700. To 2-decimal places, the national unemployment rate eased from 5.09% to 4.98% on a seasonally-adjusted basis — its lowest since June 2011. Though if taken at the standard 1-decimal place, the unemployment rate fell by 0.1ppt to 5.0%, taking it back to level from October. In trend terms, the unemployment rate remained at 5.0%, which is also its lowest since June 2011. 

Importantly, while employment growth slowed notably in 2018 it remains at a robust pace of 2.1% in annual terms and exceeds the rate of growth in the working-age population of around 1.7%Y/Y. Forward-looking indicators from private surveys continue to point to employment rising by around 20,000 per month, which is broadly sufficient to prevent the nation's unemployment rate from increasing. 


Despite a positive near-term outlook for the unemployment rate, measures of excess capacity remain elevated and have proved harder to bring lower. However, both the unemployment rate (includes those employed but wanting more hours) and the underutilisation rate (includes the underemployed and the unemployed) improved marginally in December. Lowering excess capacity is key to generating a faster pace of wages growth.  


At the aggregate level, hours worked ticked up by 0.1% in December and by 1.5% over 2018. Though, after adjusting for the increase in employment, average hours worked at an individual level continues to trend lower at 138.3 hours in the month. 


Across the states, Victoria was the standout as its unemployment rate fell by 0.3ppt in December to 4.2% — its lowest since August 2008. Victoria also led employment growth in 2018, accounting for 120,200 of the 268,600 new positions added nationwide. In New South Wales, the unemployment rate held at 4.3%, while the state contributed 94,300 to total employment in 2018.

Both Queensland (-0.2ppt to 6.1%) and Western Australia (-0.2ppt to 6.3%) saw much-needed declines in their unemployment rates. Employment was fairly solid in Queensland in 2018 but fell in Western Australia. South Australia's unemployment rate spiked from 5.3% to 5.9% and Tasmania's edged up to 5.9%. In 2018, employment growth in South Australia lifted by 1.6% and fell by 1% in Tasmania. 


Labour Force Survey — December | Insights 

Australia's labour market performed solidly in 2018. In particular, Q4 was much stronger than anticipated with employment rising by 87,300 — an outperformance of a little above 29,000 relative to market expectations over the quarter. Strength in the labour market is a bright spot in the domestic economy amid a range of other indicators pointing towards a slowing growth outlook in 2019. This could weigh on the pace of employment growth over 2019 due to a likely slowing in residential construction activity, while the upcoming federal election could also create uncertainty. As it stands, however, employment growth remains solid and above growth in the labour force, which will help to maintain the nation's unemployment rate around its existing level over the near term.  

Friday, January 18, 2019

Weekly note (18/1) | Brexit at crisis point (again)

Brexit developments took centre stage this week with the impasse in the UK Parliament continuing to pose more questions than provide answers. To recap; firstly, PM Theresa May's Brexit deal was voted against by MP's by a record margin of 432 to 202, and secondly, PM May won a subsequent confidence vote of MP's by 325 to 306. Both of these outcomes had been anticipated meaning that it was again crisis point in the more than two-year-long negotiations that have attempted to secure an agreement that would allow the UK to separate from its 4-decade association as a member of the European Union (EU), while the March 29 date for withdrawal draws near.

The prevailing dynamics could hardly be more complex. With PM May's Brexit deal lacking the necessary parliamentary support  including more than 100 of her own Conservative MP's  media reports have provided varying accounts of willingness by European officials to amend the details of the existing proposal. Meanwhile, the Jeremy Corbyn-led Labour opposition has been unable to succeed in forcing an election and have refused to enter negotiations with PM May unless a no-deal outcome is taken off the table.   


Markets appear to have taken an optimistic outlook to these events in the sense that it has, in their view, increased the likelihood of either a soft-Brexit outcome or no exit at all. Another possibility is that EU agrees to an extension to the March deadline. While appearing as least likely, a hard-Brexit scenario does still exist as a live chance given that it is the default outcome amid the current malaise. A no-deal exit scenario would be the most detrimental to the UK economy due to increased trade barriers with the EU as British-based exporters would face import tariffs, which average around 5%, while output activity could slow from delays in bringing goods across borders.


Also this week, European Central Bank President Mario Draghi in a parliamentary address again highlighted that incoming economic data had been weaker than expected due to rising uncertainties 'related to global factors' (trade and geopolitics). Industrial production data for November released during the week fell more sharply than anticipated (see here) and was the latest indicator pointing to a loss of momentum in the euro area economy. Official ECB forecasts show an expectation for economic growth to slow from 1.9% to 1.7% in 2019, impacted by weakening external trade and business investment amidst a tightening in financial conditions following the conclusion of its quantitive easing programme. The latest ECB minutes pointed to another round of cheap long-term funding to the banking sector coming under consideration. 


Stimulus measures were also a key focus in China this week. With the impact of trade tensions with the US increasing the probability of a sharper slowdown in the world's second-largest economy, Chinese officials signaled stimulus measures could include tax cuts and special local government bond issues to fund infrastructure projects. This is in addition to the bank liquidity-boosting measures recently implemented by the People's Bank of China.  

The US data flow was light this week, impacted by the ongoing government shutdown with a key report on retail sales from December unpublished. The dovish shift in communication from the Federal Reserve continued to support gains across global equity markets this week, while the anticipation for further stimulus in China drove a stronger rally in Asia.  


— — 

Turning to the Australian perspective, the soft data pulse continued this week highlighted by a slide in the Westpac-Melbourne Institute's Consumer Sentiment survey, shifting the headline index into pessimistic territory in January. At a reading of 99.6, consumer sentiment fell by 4.7% in January — its largest monthly decline in over three years and the first sub-100 read in 13 months  indicating a pivot from the ‘cautiously optimistic’ levels recorded throughout 2018 to a now slightly-pessimistic outlook. The factors weakening sentiment include; declining property prices, softening growth in the domestic economy and global uncertainties arising from trade and political tensions.

Each of the 5 sub-indexes in the survey declined in January. The steepest fall came from an expectation for a deterioration in the economic outlook over the next 12 months (-7.8% to 96.2), while the outlook over the next 5 years also posted a sizeable fall (-5.9% to 96.5). Interestingly, though, both measures sit above their longer-run averages indicating that sentiment towards the economic outlook is currently less pessimistic than usual. 

More troubling is that perceptions towards family finances compared to a year ago have deteriorated firmly below their longer-run average, which could indicate that the impact on household wealth from declining property prices and more recent falls in equity markets are being felt as growth in wages continues to remain low. Against this, a strong labour market has been key in supporting overall sentiment, however consecutive rises in the unemployment expectations component indicate that households have noticed an easing in conditions recently.

In the housing market, price declines have improved sentiment towards purchasing a home due to an easing in affordability concerns that have prevailed over recent years, though tighter lending standards are likely to be working in the other direction. Consumers are also firmly expecting property prices to continue to decline, most notably in New South Wales and Victoria where around 75% of consumers anticipate prices to either fall or remain steady over the next 12 months.    

Remaining with the property theme, the latest monthly update for housing finance showed a resumption in the downtrend in November following a momentary pause in October (for our full analysis see here). Finance approvals made to owner-occupiers fell by 0.9% in the month, a slightly better-than-expected result (-1.5%), while the total value of commitments made during November fell by 2.9% to $22.944bn 
— its lowest level in nearly 5 years — with a 4.5% contraction in lending to the investor segment driving the weakness.  

Perhaps of most significance in this release was a slide in average home loan sizes for both non-first home buyers and first home buyers, which is shown as our chart of the week. This has been impacted by tightening bank lending standards, which has weighed on borrowers' access to credit, while property prices themselves after having fallen for more than 12 months now on a national basis are also likely to be contributing to reduced loan sizes. Compared to their recent peaks from mid-2018, average loan sizes have fallen by around 4% to $395,500 for non-first home buyers and to $336,500 for first home buyers. 


Chart of the week

Lastly, data for the September quarter showed that dwelling commencements had contracted by 5.7%, with declines for both units (-7.3%) and houses (-4.5%). Though the number of units, and dwellings overall, under construction remained at a highly-elevated level, the volume of work approved but not yet commenced declined for the third consecutive quarter, which reflected the weakening trend from the building approvals data as completions continued to gather pace. The indications continue to point to residential construction becoming a drag on growth in the domestic economy over the next 1-2 years.  

Wednesday, January 16, 2019

Australian housing finance resumes its slide

Australian housing finance approvals resumed their slide in November coming after a momentary rise in the previous month. Given the prevailing climate in which national property prices continue to fall from their recent peak, while the impact of tighter lending standards continues to work through, the fundamentals continue to point to further declines in the demand for housing finance.


Housing Finance — November | By the numbers
  • Housing finance approvals to owner-occupiers (excluding refinancing) fell by 0.9% in November to 51,967, which was slightly better than the 1.5% decline forecast by markets (prior revised +2.1%m/m from +2.2%). Over the past year, finance approvals have fallen by 7.9% (prior -4.8%Y/Y).
  • The total value of housing finance commitments (excluding refinancing) fell by 2.9% in November to $A22.944bn — its lowest level since January 2014 — with the annual decline deepening to -16% from -11.6%Y/Y to October. 
  • Lending to owner-occupiers (excluding refinancing) fell by 1.7% in the month to $13.611bn having fallen by 10% compared to the level from a year earlier. 
  • Investment lending contracted by 4.5% in November to $9.334bn — its lowest level since mid-2013 — marking a 23.4% slide over the past 12 months. 


Housing Finance — November | The details 

Looking at the breakdown, the ABS reported a 2.9% fall in the total value of 'new' housing finance commitments made in November to $22.944bn. Most of that fall came from a further weakening in the investor segment, which fell by 4.5% (or by around $444m) to $9.334bn to its lowest level since June 2013. Lending to owner-occupiers declined by 1.7% (or by approximately $231m) to $13.611bn. 

The value of refinancing commitments eased by 0.9% in the month to $6.184bn. 

Activity in the first home buyer segment looks to have lifted in November with loan approvals increasing by 3.5%, though the average loan size had contracted slightly. 


According to the latest estimates, the average loan size for first home buyers eased by 0.7% in November to $336,500 (+2.8%Y/Y), while the non-first home buyer average also eased by 0.3% to $395,500 (-1.7%Y/Y). As the chart, below, highlights, the average loan size for both categories have been falling since mid-year, which reflects both falling property prices and the impact of tighter financing conditions reducing borrowing capacity. 


In terms of loan approvals made to owner-occupiers, the 0.9% fall in November to 51,967 was better than expected (-1.5%) but have fallen notably by 7.9% over the past year. This weakness has been most apparent in construction-related approvals, referring to finance approvals for owner-occupiers to either purchase a newly-constructed dwelling or to build a new home (including off-the-plan sales), which have fallen by 12.3% over the past 12 months compared to a 7% slide in approvals to purchase established dwellings. A continuation of this trend is likely given the ongoing weakness in building approvals data, which followed through to a decline in dwelling commencements in the September quarter as reported by the ABS yesterday (see here). 

The ABS does not provide finance approvals estimates for the investor segment.  


Across the states, the detail fo owner-occupier finance approvals in November was; New South Wales -1.5%m/m (-11.3%Y/Y), Victoria +0.7%m/m (-5.6%Y/Y), Queensland -0.7%m/m (-9.6%Y/Y), South Australia -0.8%m/m (+1.0%Y/Y), Western Australia +2.4%m/m (-0.7%Y/Y) and Tasmania -9.2%m/m (+3.5%Y/Y). 

As the chart, below, shows, approvals in New South Wales have continued to slide over the past year, while Victoria has also been trending lower around a more volatile profile. Those two states have led the national decline, though the deterioration in Queensland should not escape focus, particularly as the state enjoys affordability advantages over the two 'majors'. Against that trend, approvals in Western Australia have been becoming gradually less negative.      


Housing Finance — November | Insights  

The sharp slowing in housing finance approvals over the past year reflects the well-documented impact from tighter lending standards in response to macro-prudential policies implemented by the banking regulator APRA. These policies have had a telling impact on slowing housing finance growth, particularly in the investor segment, which led the regulator to announce the final unwinding of these measures in late 2018, applicable from January 1 this year. 

With property prices on a national basis continuing slide following the tightening in lending standards, this has also had an impact in slowing the demand for housing finance given an expectation for further declines as indicated by yesterday's Westpac-Melbourne Institute of Consumer Sentiment survey (see here). That survey also highlighted two interesting points. Firstly, while falling property prices have played a part in easing affordability concerns, the tightening in lending standards have been working in the other direction, as seen by the reduction in average loan sizes in today's release. Secondly, the expectation for further falls in prices could result in prospective buyers waiting for that to play out before stepping into the market. 

All-in-all, there is little in the data to hand to indicate that the deterioration in housing finance is reaching its conclusion. Lastly, for technically-minded readers, the ABS confirmed today that this Housing Finance data series will now be discontinued. In its place, the Bureau will now publish a monthly series called Lending to Households and Businesses, which combines the Housing Finance and Lending Finance releases, from next month onwards (see the details here). 

Friday, January 11, 2019

Weekly note (11/1) | Powell ‘put’ reassures markets

The first full week of 2019 saw global equity markets rise strongly as risk sentiment improved notably following an unexpectedly dovish shift in communication from the US Federal Reserve. This was also supported by positive reports emanating from trade negotiations between a US delegation and officials from China, while late last week the People's Bank of China announced a new round of policy easing targeted at increasing liquidity in the banking sector to ward off the risk of a slowing growth outlook in the world's second-largest economy.

The turnaround in risk sentiment came last Friday when US Federal Reserve Chair Jerome Powell speaking to the American Economic Association in Atlanta ameliorated market concerns that further policy tightening could accentuate a slowing outlook
 for economic growth by saying that "we (the Fed) are always prepared to shift the stance of policy and to shift it significantly".   


While key data continues to show strength in the US economy, highlighted by a much stronger-than-expected employment report in December (see here), forward-looking indicators have been pointing towards a slowdown in activity in the domestic economy. In this context, Chair Powell highlighted a preparedness to balance strength in incoming data with the risks of a slower growth outlook, with "muted inflation readings" affording the Fed flexibility in its policy decisions. The comments were well received by markets, who had been left greatly disappointed late last year when the Fed indicated an expectation for continuing with policy tightening in 2019 as covered in our previous weekly.


Wednesday's FOMC minutes then reiterated the change in Fed commentary, which pointed to a patient data-dependent approach in 2019 with the path for policy tightening now "less clear than earlier" due to financial market volatility, which has potential spill-over impacts for consumption and investment, and renewed concerns over the global growth outlook driven in part by trade tensions. From a fundamental perspective, Committee members remain confident in the outlook for the domestic economy with output growth anticipated to run above potential in 2019 driven by household spending and business investment, though assessments will clearly now be more nuanced to the risks that have unsettled markets over recent months.     


Over in Europe, the European Central Bank (ECB) minutes from December expressed both optimism and caution. Confidence in underlying economic conditions  despite a recent weakening in incoming data  had led to the conclusion of its near 4-year long 2.6 trillion asset purchase programme (APP), though risks to the growth outlook while still assessed as broadly balanced were "moving to the downside" due to geopolitical and trade uncertainties and market volatility. In particular, the minutes described the outlook as "fragile and fluid, as risks could quickly regain prominence or new uncertainties could emerge".


While asset purchases have now concluded, the Governing Council's measures to ensure ample stimulus remains in place include; forward guidance for key interest rates to remain on hold "at least through the (European) summer of 2019" and an intention to reinvest payments from maturing bonds purchased under the APP "for an extended period of time" after when it starts to raise key interest rates. Additionally, the minutes indicated that the ECB may revisit providing another round of cheap long-term loans to the banking sector.


Continuing the trend of softening data pointing to slowing momentum in the European growth outlook, a measure of economic sentiment in the region eased for the 12th consecutive month during the week driven by the consumer, services and construction sectors. More positively, euro area data for November showed stronger-than-expected outturns from retail trade and the labour market, where the region's unemployment rate fell to a decade-low 7.9%, which features as our chart of the week.


Chart of the week

At the completion of an optimistic week in markets, equity indexes in the US had risen by around 2.5 to 3.5%, Asian markets gained between 1.5 to 4% and Europe lifted by around 1%. As a proxy for improved risk sentiment in markets, the Australian dollar posted a 1.4% gain against the US dollar this week. The spread between US 10 and 2-year bond yields narrowed from a little above 17 basis points to around 16 basis points over the week.
     
 
— — —

In Australia this week, the data flow was decidedly soft fitting with the trend experienced in other major advanced economies recently. Separate indicators from the Australian Industry Group (AiG) showed activity levels slowed in the nation's manufacturing, services and construction sectors in December. 

The AiG's Performance of Manufacturing Index eased to a sub-50 reading for the first time since August 2016 indicating that activity levels had contracted in December. In the services sector, the AiG's headline measure was still expansionary at 52.1 despite slowing in the month, however the employment sub-index fell sharply to indicate that firms had been reducing staffing levels. The weakest read came from Friday's AiG Performance of Construction Index (PCI), which fell by its sharpest rate in more than 5 years to 42.6. This result was weighed heavily by contracting activity in residential construction for both houses and apartments, which respondents had reported was due to a range of concerns including; tighter financing conditions, falling property prices, soft investor demand and oversupply with projects reaching completion. 


This followed a weak report for building approvals for November that was released by the ABS on Wednesday (for our full analysis see here). Total dwelling approvals fell by 9.1% in the month driven by weakness in house and unit approvals compared to expectations for a broadly-flat outcome. Though statistical volatility likely overplayed the monthly result, the trend was broadly consistent with the PCI data. While the near-term outlook is supported by a highly elevated pipeline of work, residential construction appears likely to become a drag on overall economic growth, possibly towards the back end of 2019. 


In better news, retail sales for November came in stronger than forecast by posting a rise of 0.4% in the month as Black Friday promotions drove a heavy increase in online spending (see our analysis here). The significance of online retail in Australia continues to surge and the November sales promotion period will become of increasing importance to the sector. Recent history indicates that it may also be driving a shift in consumer behaviour by encouraging a bringing forward in spending in the lead-up to Christmas, which then, in turn, may attenuate spending in December.


Lastly, the nation's trade balance was softer than anticipated in November due to rising spending on imports for capital goods (see our analysis here). Both coal and iron-ore export volumes weakened during the month but this was moderated by the surging LNG sector, where export values increased to a new record high $4.56bn in November.  

Thursday, January 10, 2019

Online spending drives Australian retail sales in November

A surge in online spending following promotional activities for Black Friday drove a stronger-than-expected result for Australian retail sales growth in November. A similar trend occurred in November in the previous year where spending in the lead-up to Christmas was bought forward but then declined in December.

Retail Sales — November | By the numbers
  • Total retail spending lifted by $114.8m, or by +0.4%, in November to $A27.115bn, which outpaced the market forecast for growth of +0.3%. Turnover growth in October was unrevised at +0.3%.    
  • Annual growth in retail spending fell from a pace of 3.6% in the previous month to 2.8%, which was impacted by a sizeable base effect as a 1.2% jump in sales growth from November last year fell out of the annual calculation. In trend terms, annual growth has been tracking at a pace of around 3.6% over the past 3 months. 


Retail Sales — November | The details 

The key to retail spending in November was the impact of Black Friday sales and other variations including click frenzy, which sees retailers participating in promotional activities, mostly on online platforms, though there is some spillover into traditional retailing.  

On a seasonally-adjusted basis, total retail spending lifted by $114.8m to $A27.115bn in November. According to the ABS' estimates for online retail, which are not seasonally adjusted, spending surged by 17.8% in the month, or by $286.6m, to $1.892bn. This resulted in the contribution from online spending to total retail sales accelerating by 0.7ppt to a new record-high level of 6.6% in original terms, which is 1.1ppts above its level from a year prior. 

      
Looking across the categories, those typically linked to the online space — such as clothing and footwear and household goods — led turnover growth in the month. Clothing and footwear posted a 1.5% rise, which followed a 2.9% increase last month, while annual growth accelerated from 5.4% to 5.9%. Household goods spending lifted by 1.2% in November, but the annual rate fell to near flat from 3.4%. 

Spending in department stores lifted by 0.4% in November to match the rate of growth in national spending, while spending in cafes and restaurants and in 'other retailing' (pharmaceuticals, books, stationery etc) both fell by 0.1%.     

Food retailing — the largest category at around 40% of total retail sales — lifted by 0.2% in the month, which inched annual growth up to 4.0%. 

    
Removing the impact of the food category, broad-based discretionary retail spending increased by 0.6% in the month, though annual growth fell from 3.4% to 1.9% reflecting the base effect discussed earlier. 


Turning to the state detail, the outcomes were mixed in November. New South Wales led with an increase of 0.8%, which follows two consecutive monthly declines. Annual growth has now slowed to just 1.9% from a recent peak of 4.2% in August. This is despite very strong labour market conditions and solid population growth, potentially indicating some impact from declining property prices. 

Turnover growth was soft for Victoria at just 0.1%m/m, though its annual rate remains the strongest in the nation at 4.6% despite a recent cooling. Victoria's retail sector has benefitted from a very strong population growth and residential construction activity.   

For the other states, Western Australia (+0.6%m/m) and Queensland (+0.4%) posted gains, while South Australia was flat and Tasmania declined by 0.2%m/m.   


The charts, below, show a comparison in annual growth in retail spending across the states. 


Retail Sales — November | Insights  

Positively this was a stronger-than-expected result, though it could turn out to be a repeat from 2016 and 2017 where sales growth had lifted in November before declining in December. More broadly, this could represent a shift in consumer spending patterns in the lead-up to Christmas as they look to take advantage of sales promotions amid an increasing expansion in online spending. We can expect these retail sales data releases to take on increasing importance for markets in 2019 given the well-documented headwinds facing the household sector from low income growth and a likely negative wealth impact from declining property prices. The Reserve Bank of Australia remains sanguine on the latter.