Independent Australian and global macro analysis

Tuesday, November 30, 2021

Australian Q3 GDP -1.9%; 3.9%Y/Y

The damage from the Delta lockdowns over the winter was smaller than expected with the Australian economy contracting by 1.9% in the September quarter against the market consensus for a 2.7% fall. Output growth was up 3.9% through the year, though that is a sharp slowdown from the 9.5% pace seen in Q2. The decline in output compares with a larger 5.4% fall in hours worked across the economy in the quarter.     


Going into Q3, the Australian economy was in the expansion phase and full of running after earlier recovering from the 2020 Covid recession. But with Delta outbreaks sending around half of the population into lockdown for much of the quarter, GDP fell back to be 0.2% below its pre-pandemic level, temporarily setting back the expansion and delaying the return to its pre-pandemic path. 
 

High-frequency data indicates a robust recovery is now underway and the economy should easily regain the lost output in Q4. A key reason for this is the elevation in accumulated household savings in the quarter, from 11.8% to 19.8%. This was driven by a rise in real household disposable income (4.3%q/q) as the federal government ramped up its Covid-19 Disaster Payments to levels approaching the JobKeeper wage subsidy of 2020. Savings were also running up due to falling household consumption (-4.8%q/q) during the lockdowns. However, there are also headwinds to the recovery building from uncertainty relating to the new variant, the withdrawal of fiscal and monetary stimulus and capacity constraints in some sectors.   


Looking more broadly at Q3's outcome, it was the decline in household consumption that drove the overall contraction in GDP. 


Household consumption was close to returning to pre-pandemic levels in Q2, but it has now slid back to be 5.2% lower than at the end of 2019. The largest falls were in services (-9.5%q/q) and discretionary (-11.3%q/q) areas as these categories dropped back to be around 10-15% below pre-pandemic volumes respectively. In particular, the lockdowns drove significant falls in consumption for transport services (-40.9%q/q), hotels, cafes and restaurants (-21.3%q/q) and recreation and culture services (-11.8%q/q). Conversely, both goods (2.3%) and essential (1.1%) consumption remain above end 2019 levels. However, goods consumption overall was down in Q3 (-3.3%) on the back of falls in vehicle (-8.7%q/q) and fuel sales (-13.1%q/q), furniture and furnishings (-4.6%q/q) and clothing and footwear (-22%q/q).  


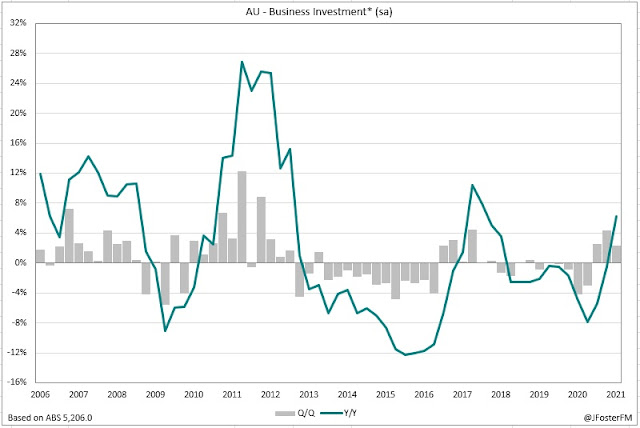
Inventories were a large drag on activity in the quarter (-1.3ppt), mainly on a sharp fall in wholesale inventories with the cuts seen in global motor vehicle production due to input shortages lowering the inventories of domestic motor vehicle dealerships. Business investment contracted by 1.1%q/q as the upswing in equipment spending (-3.1%) was paused during the lockdowns and potentially slowed by the global supply chain pressures. Public demand lifted sharply (3.3%) to add to growth as governments stepped up the rollout of the Covid-19 vaccines. Net exports (+1ppt) reversed their decline from the previous quarter as resources exports rebounded and imports contracted in line with weak domestic demand conditions. 

Link to the full review here 


Australian dwelling approvals -12.9% in October

Australian dwelling approvals posted a larger-than-expected fall in October as a recent rise in higher-density approvals was retraced. House approvals lifted but were coming off a sizeable decline in September. 
  
Building Approvals — October | By the numbers
  • Dwelling approvals (seasonally adjusted) fell 12.9%m/m in October to 15,911 (prior: -3.9%m/m) against the market forecast for a decline of 1.5%. Annual growth in approvals turned negative (-8.1%) for the first time since June 2020.  
  • House approvals advanced 4.5% on the month to 10,906 to be 4.4% lower over the year. This followed a 15.2%m/m fall in September. 
  • Unit approvals were down 36.1%m/m to 5,005 after rising sharply in the previous two months. Annual growth swung to -15.1% from 45.5%. 


Building Approvals — October | The details 

Volatility in the higher-density segment led to a 12.9% fall in dwelling approvals in October. In percentage terms, this was the largest month-on-month fall seen since May 2020. Approvals have been retracing their earlier surge over recent months following the end of the HomeBuilder scheme to new applicants in mid-April. As a result, detached house approvals and approvals for renovations (2.6%m/m), which could also qualify for the grants if certain criteria were met, are now well off their peaks from earlier in 2021. Capacity constraints in the construction sector and recent lockdowns may also be weighing on approvals, though on the other hand housing prices nationally are still on the rise.


Higher-density approvals had lifted sharply over August-September (32.9%), but the decline in October (-36.1%) more than retraced this move. In particular, the high-rise segment in Sydney drove the decline, though Melbourne also showed weakness in this space. Overall, though, higher density approvals in the nation's two largest cities are well off the low levels seen following the onset of the pandemic.


At the state level, total building approvals in New South Wales were down 29.4%m/m with smaller declines coming through from South Australia (-8.1%), Western Australia (-2.7%), Victoria (-2.0%) and Tasmania (-1.8%). Queensland went against the trend with a 2.2% rise. 


Building Approvals — October | Insights  

The residential construction pipeline is very elevated following the run up in approvals seen from mid-2020 on the back of significant stimulus measures. House approvals are well off their peaks but are still elevated on pre-pandemic levels even after some of the stimulus measures have been wound back. Higher density approvals have been volatile from month to month in 2021 but are on a rising trend. 

Monday, November 29, 2021

Australia Current Account $23.9bn in Q3; net exports +1ppt

Australia's current account surplus has reset to a new record high in Q3 coming in just below $24bn. Net exports are expected to add 1ppt to quarterly GDP growth. Export volumes partially rebounded in Q3 but imports contracted heavily amid the Delta lockdowns and the global supply chain pressures.  

Balance of Payments  — Q3 | By the numbers
  • Australia's current account surplus lifted by a further 4.4% in Q3 to $23.9bn, a new record high but lower than forecast by markets ($27.8bn). The surplus posted in Q2 was revised up from $20.5bn to $22.9bn.  
  • The trade surplus widened in the quarter to $38.9bn (up $8.1bn) as export credits lifted by 7.6%q/q to outpace a 1.6% rise in import spending.
  • The income deficit increased sharply by $7.7bn to $14.3bn reflecting higher returns to foreign investors.    
  • ABS reported that net exports will add 1ppt to GDP growth in Q3


Balance of Payments — Q3 | The details 

These remain extraordinary times in the history of Australia's trade performance as volatility associated with the pandemic has occured alongside a surge in commodity prices. The nation's surplus on current account has reset to a new record level for the 4th quarter in succession. After widening by 4.4% in Q3, the current account surplus now stands at $23.9bn and is equivalent to more than 4% of GDP. The widening in Q3 was driven by an $8.1bn rise in the trade balance, which more than offset a large increase in the income deficit ($7.7bn). 


Trade volumes reflected the effects of the resumption of resources exports and the hit to imports amid the global supply chain pressures and the Delta lockdowns. Export volumes were coming off a 3.4% fall in Q2 and advanced by 1.2%q/q. Increased goods exports (2.7%q/q) more than made up for a fall in services (-8.4%q/q). The key dynamic was a rebound in resources (3.0%q/q) after adverse weather disrupted shipments in Q2 (-6.1%q/q). LNG (7.6%), metal ores (mainly iron ore) (3.1%) and coal (1.3%) all contributed. 


Import volumes contracted sharply (-4.0%q/q) as global supply chain pressures weighed and as domestic demand conditions weakened through the lockdowns. Goods imports (-3.5%q/q) were hit by a large fall in consumption goods (-9.5%q/q) and by a more modest decline in intermediate goods (-1.5%q/q). Regarding the fall in consumption goods, the key factor here was a plunge in vehicle sales (-17.9%q/q) reflecting the hit to production caused by input shortages. This is consistent with the sharp decline in wholesaler inventories reported yesterday.   


For context, exports are down 11.8% on pre-pandemic volumes and imports are lower by 8.9%. Highlighting the significant goods/services imbalances created by the pandemic, goods exports are only 1.8% below pre-pandemic levels compared to a 47.8% shortfall on services. For imports, goods are up 7.3% on pre-pandemic volumes but services are down 58.5%. The services side has been heavily affected by the closure of the international border over the pandemic.  

  
With exports up in Q3 (1.2%) and imports down (-4%), net exports will make a positive contribution to GDP growth. The ABS estimates this contribution to be +1ppt; an outcome that would reverse the fall seen in Q2. 


Balance of Payments — Q3 | Insights 

Another record high seen on the current account surplus as the tailwinds from elevated commodity prices continued to support national income, albeit with iron ore rolling over more recently. Net exports are expected to add 1ppt in the quarter and should help contain the expected decline in GDP to no more than 3%. Exports rebounded in Q3 as resources shipments came back online, though global supply chain pressures and the domestic lockdowns hit imports. 

---

In other news today, the ABS reported public demand is expected to add 0.7ppt to quarterly GDP. Government spending lifted sharply in Q3 (3.6%), which looks to be attributable to the rollout of the Covid-19 vaccines. 

Source: ABS 

Sunday, November 28, 2021

Australian Business Indicators Q3: Inventories -1.9%

Third quarter Australian business inventories contracted sharply by 1.9% amid the constraints caused by global supply chain pressures and extended lockdowns domestically. Sales plunged as spending opportunities were restricted, though fiscal support and strength in commodity prices saw company profits, on aggregate, rise in the quarter. A decline in wages in Q3 reflected the disruption in the recovery in the labour market from the lockdowns.  

Business Indicators — Q3 | By the numbers 
  • Inventories declined by 1.9%q/q to $168.9bn; a significant downside surprise on the median forecast for a flat outcome. Through the year growth in inventories eased to 0.7% from 2.4%. 
  • Company gross operating profits were 4% higher in Q3 (vs 2.3% exp) at around $123bn, holding annual growth at 5.4%.  
  • Wages and salaries contracted by 0.8% in the quarter to $152.7bn, cutting annual growth to 4.7% from 8.2%. 
  • Sales contracted by 3.5%q/q due to the Delta lockdowns and by -3.9%q/q in the non-mining industries.   


Business Indicators — Q3 | The details

The return of extended lockdowns across large parts of the nation over the winter was a significant shock for Australian businesses. Social distancing measures restricted spending opportunities and business sales plunged back below pre-pandemic levels as a result. However, governments ramped up fiscal support in response as occurred in 2020. 

Inventory levels contracted sharply relative to market expectations, down 1.9%q/q vs the median estimate for a flat outcome. The sharp fall in sales and the pressures in global supply chains from product shortages and delays in delivery times hit production and led to both wholesaler (-4.4%) and manufacturing (-1.3%) inventories driving the overall decline. 


Retail and hospitality demand had been incredibly strong going into Q3. But with restrictions now curbing that demand, inventory levels in these industries were no longer being run down. Retail inventories were up 0.8%q/q and accommodation and food services lifted by 2.6%. This accumulation of stock will currently be helping to meet the rebound in household spending during this reopening phase in Q4. 


Turning to profits, gross company profits increased by 4.0% in the quarter, supported by government transfers as sales were falling throughout the lockdowns. Profits were stronger again if adjusted for changes in inventory valuations (national accounts use a similar methodology), up 4.6% in the quarter. Non-mining profits had been retracing from the high levels seen in 2020 over recent quarters as fiscal supports were being withdrawn. This retracement was halted in Q3 as non-mining profits advanced by 2.5%, the first quarterly rise recorded in a year. 

However, the industries most affected by the lockdowns saw profits decline, with the fiscal support attenuating the magnitude of the fall in these cases. Profits were down in accommodation & food services (-12.5%), transport (-12.7%), other services (-5.8%), retail trade (-1.5%) and arts & recreation (-1.2%). Profits lifted sharpest in construction (19.7%), professional services (17.2%) and manufacturing (10.3%). Mining profits lifted by a further 5.7%q/q, surging to be almost 68% higher through the year driven by elevated commodity prices. 


Wages and salaries paid declined by 0.8%q/q contracting for the first time since Q2 2020. Restrictions on trade led to a fall in employment and a loss in hours worked, which drove sharp declines in wages paid in the quarter in accommodation & food services (-23.5%), arts & recreation (-22.9%), other services (-6.4%) and retail trade (-4.5%). 


Business Indicators — Q3 | Insights

Based on today's report, inventories will likely subtract heavily from GDP growth in Q3, potentially by around 0.7ppt, reflecting supply chain and lockdown disruptions. Sales contracted sharply in the quarter as lockdowns restricted spending. On aggregate, fiscal support more than made up for this, however; the impact on profits from the lockdowns varied from industry to industry. A decline in the wages bill in Q3 reflected the recovery in the labour market being upended by the return of restrictions, with large falls in employment and hours worked. 

Friday, November 26, 2021

Macro (Re)view (26/11) | Stability in uncertain times

The status quo was confirmed in the US this week as President Biden announced the renomination of Jerome Powell to chair the Federal Reserve. Initially, the response was steeper yields from the front of the curve through to the belly, reflecting increased confidence in a more condensed timeline to raising rates than currently indicated by the Fed. However, a significant repricing subsequently occured on the news of the emergence of a new Covid strain in Africa. In the minutes from the Fed's November meeting, it was outlined that "some participants" on the FOMC had pushed for a more accelerated QE taper schedule than the $15bn per month reduction ultimately settled on. But the FOMC notes that it is open to adjusting the pace "if warranted by changes in the economic outlook". While the taper process could end sooner than currently implied in mid-2022, the news on the virus has given markets some pause for thought. Ideally, the Fed wants new QE purchases to have ended before it starts raising rates, and preferably with a lag in between.       

A faster taper was being discussed in light of the persistence of price pressures, which has increased uncertainty within the FOMC around the inflation outlook. The consensus view remains that supply/demand imbalances associated with the pandemic are driving up inflation but are expected to diminish in 2022. However, the more hawkish voices on the Committee are citing factors such as a broadening of higher prices and faster wages growth as reasons why it may need to act sooner rather than later. This is where the balance of risks currently sits and this was reinforced by the Fed's preferred inflation gauges rising further in October. Headline PCE inflation lifted from 4.4% to 5.0%yr while core PCE inflation advanced to 4.1%yr from 3.7%, with both running at their fastest since the early 1990s. Despite the concerns over inflation, the US consumer remains in very robust shape. In fact, growth in real spending rose 6.6% over the year to October to comfortably outpace the rate of inflation. Beneath the surface, demand for goods expanded by 7.3%yr and remains at a highly elevated level, while services consumption (6.3%yr) continues to recover from the depths of the pandemic. This configuration of outcomes means that the rotation back towards pre-pandemic shares of goods and services is taking longer than the Fed expected and is a key reason for the extended run of high inflation prints. 

Over in Europe, concerns around its Covid situation have increased through the week, with the news of the new strain adding a layer of complexity. This comes at a time when the euro area economy had looked to be accelerating on the strength in services sector activity as the flash composite PMI was posted at 55.8 in November from 54.2 in October. Capacity constraints remain a headwind for manufacturers and are contributing to price pressures, though activity levels were still consistent with expansion in the sector. The account of the ECB's late October meeting highlighted the upside risks to the inflation outlook and that, in that scenario, retaining optionality in its monetary policy response was key. Accordingly, the account notes the consensus view was that the March 2022 end date for adding new net PEPP purchases remained appropriate. Interestingly, ECB Executive Board member Isabel Schnabel in a Bloomberg interview indicated the PEPP could remain on standby after March 2022, casting some doubt on expectations that its other QE program (APP) may be repurposed. In the UK, BoE Governor Andrew Bailey spoke of the "hazardous" situation central banks faced giving forward guidance on rates amid a highly uncertain economic outlook. Lastly, across the Tasman, the RBNZ got its second increase for the hiking cycle away this week, raising rates by 25bps to 0.75% as inflation continues to run well above the target range. The latest Monetary Policy Statement upped the projection for the policy rate to peak at 2.6% in 2024 from 2.1% previously.  

— — 

Switching to Australia, risks appear to be tilted to the upside going into next week's Q3 GDP report that will provide the accounting of the impact of the Delta lockdowns. Consensus is currently for a contraction in Q3 GDP of around 3%, though the indicators that were released through the week were not as negative as anticipated, indicating estimates are more likely to be revised up rather than down at this stage, albeit with a few other key inputs (inventories, government spending and net exports) yet to come to hand. My preview of the Q3 national accounts can be accessed here.

The decline in construction activity was -0.3% in Q3, much less severe than the 3% fall expected (full review here). While New South Wales weighed heavily (-8.1%q/q) due to the temporary suspension of construction work during the Sydney lockdown, there were broadly offsetting rises posted in Victoria (5.8%q/q) and Queensland (5.5%). The outcome in Victoria was a notable surprise, with the construction shutdown appearing to have occured too late in the period to have hit reported activity. The details of the report showed building work nationally was down 0.9% in Q3, with non-residential volumes falling 2.2% as residential work stalled for the second quarter in succession. In the latter, capacity constraints from labour and materials shortages are an increasing headwind. A 0.4%q/q rise in engineering work attenuated the weakness in the building activity. 

The upswing in Australia's capex cycle was full of running when the Delta lockdowns hit. A 2.2% fall in capex in Q3, broadly as expected, has halted the momentum but this should prove to be a temporary setback (full review here). A negative impulse to GDP will flow through from a large fall posted in equipment spending (-4.1%q/q) as the lockdowns saw firms delay purchases, while the global supply chain pressures may have been an additional headwind. Meanwhile, buildings and structures capex was near flat (-0.2%), weighed by the temporary shutdown of construction sites in Sydney. Encouragingly, firms appear to have looked through the lockdowns as investment plans for 2021/22 were upgraded sharply by 8.3% on the previous estimate to $138.6bn. Taken with the upbeat expectations for future conditions reported in recent surveys, this indicates firms are intending to make up for lost time in Q3 by elevating capex spending plans through the remainder of the financial year. Strong business investment is likely to become a key driver of economic activity in 2022 as the reopening rebound is cycled. 

On the recovery, the data through the week was consistent with a sharp rebound. Private sector activity expanded at its fastest pace in 5 months as the composite PMI reading for November accelerated to 55.0 from 52.1 in October. However, this was being accompanied by increased price pressures with input costs lifting at a record pace. In the labour market, the ABS's payroll jobs index accelerated by 1.4% over the second half of October as restrictions were being eased. Meanwhile, retail sales surged at their fastest pace in 11 months rising by 4.9% in October, coming in well ahead of market expectations (2.5%).  

Thursday, November 25, 2021

Preview: Australian Q3 GDP

Australia's national accounts for the September quarter are scheduled to be released by the ABS today at 11:30am (AEDT). Conditions in the Australian economy deteriorated significantly in Q3 as the expansion phase gave way to the return of lockdowns following outbreaks of the Delta variant of Covid-19. Lockdowns were in place for around half of the Australian population for much of the quarter, leading the public health authorities to accelerate the rollout of the vaccine to meet state and national targets. Consensus is for GDP to have contracted by 2.7% in Q3; an outcome that would see GDP fall back below pre-pandemic levels. Prior to the Delta outbreaks, momentum in the Australian economy was strong; GDP had expanded by 0.7% in the June quarter and was up by 9.6% from the depths of the COVID recession a year earlier.


Late in Q2, the Delta variant emerged in Australia resulting in an acceleration in daily caseloads to their highest levels of the pandemic over the winter. Extended lockdowns were seen in the capital cities of the states of New South Wales and Victoria and in the Australian Capital Territory. Shorter periods of restrictions were in place at various stages in Queensland, South Australia and in the Northern Territory. 


Mobility indicators in Sydney (NSW) and Melbourne (Vic) fell sharply to around the lows of earlier lockdowns but, on average, remained much more elevated across the other capitals. 


Lockdowns and their associated disruptions upended the recovery in the labour market. This led to significant declines in employment levels, hours worked and in the rate of workforce participation. In response, income support through the Federal Government's Covid Disaster Payments was increased to similar levels to last year's JobKeeper wage subsidy, boosting accumulated household savings. 


Household consumption was severely affected by the lockdowns as spending opportunities in retail and discretionary services were restricted. The categories of retail sales that were hardest hit during the quarter were cafes and restaurants, clothing and footwear and department stores, consistent with earlier lockdowns. However, there was a degree of substitution in spending patterns as online retail sales soared to new record highs in Q3. Retail volumes contracted by almost 9% in the quarter across NSW, Victoria and the ACT, attenuated only slightly by a 1.6% rise across the rest of the nation.


Due in part to restrictions on property inspections, activity in the key Sydney and Melbourne housing markets slowed. However, housing prices continued to rise with the increase in the national median price pressing 5% in the quarter. Different from earlier lockdowns, tighter restrictions were placed on construction activity. Work on sites was temporarily suspended in Sydney and its surrounding areas and statewide in Victoria late in the quarter. Capacity constraints were an increasing headwind for residential construction. The lockdowns also disrupted the upswing in business investment as non-residential construction activity was restricted and equipment spending weakened. Net exports appeared to have rebounded in the quarter after subtracting heavily from GDP in Q2 when adverse weather conditions affected resources exports. During Q3, pressures in global supply chains and energy shortages pushed up prices for the nation's coal and LNG exports, though iron prices fell from elevated levels.   

As it stands | National Accounts — GDP
 
Ahead of the Delta lockdowns momentum in the Australian economy was strong. Real GDP expanded by a stronger-than-expected 0.7% in Q2, taking growth over the first half of the year to 2.6%. Household consumption was the main driver of growth in Q2 as spending on discretionary services continued to recover. Australian GDP had rebounded by 9.6% from the depths of the national lockdown a year earlier and was 1.6% above its pre-Covid level.  


Offshore, accelerating vaccine rollouts enabled restrictions to be eased, in turn supporting a pick-up in economic growth and keeping demand for Australia's key commodity exports elevated. Across OECD economies, GDP increased by 1.7% in Q2 from growth of 0.7% in Q1. The wider availability of consumption opportunities for households, particularly in services, drove sharp rebounds in the UK (5.5% from -1.4%) and in the euro area (2.2% from -0.3%) after lockdowns had been lifted early in the summer. In the US, output expanded at a solid pace of 1.6% in Q2, leading to GDP retracing its pandemic-induced decline. Meanwhile, the expansion in China continued with output rising by 1.2% in the quarter after a soft start to the year.  


In Australia, household consumption lifted by 1.1%q/q and was now only just below its pre-pandemic level. Strong sentiment, accumulated savings and eased restrictions were continuing to rebalance the profile of household spending, with discretionary (1.6%q/q) and services consumption (1.3%q/q) recovering further. This was also supported by the recovery in the labour market through the boost to labour incomes. However; on aggregate, real household disposable income contracted in the quarter (-1.0%), mainly reflecting the withdrawal of the JobKeeper wage subsidy. Rising consumption against a fall in real income drove a decline in the household saving ratio, but it remained elevated at 9.7%.   


Private investment lifted by 2.8% in the quarter, continuing its expansion on the back of stimulus measures and the strength of domestic demand conditions. However, there was a sharp slowing in residential construction activity (1.7%) compared to the previous two quarters. This reflected capacity constraints in the sector following the strong run-up in demand generated by the HomeBuilder scheme, rising housing prices and low interest rates. Business investment recovered to pre-pandemic levels following a 2.3% rise in the quarter. This had been driven by a strong rebound in equipment spending, supported by tax incentives and as a response to meet the strength in consumer demand. 


These factors had contributed to a substantial rise in imports over recent quarters. Exports, however, contracted sharply in Q2 (-3.2%) due to adverse weather conditions hampering resource shipments. As a result, net exports weighed heavily on activity in Q2 (-1ppt). 

Key dynamics in Q3 | National Accounts — GDP 

Household consumption — Spending opportunities were heavily restricted by lockdowns across large parts of the nation in Q3. Retail sales volumes contracted by 4.4% in the quarter, their largest fall on record with the non-essential and discretionary services categories hardest hit. However, online sales surged to new peaks. Accumulated household savings were likely boosted by enhanced income support measures as the labour market recovery was disrupted by the lockdowns. Consumer sentiment declined from elevated levels but showed more resilience than in 2020.   

Dwelling investment — Dual headwinds from the lockdowns and capacity constraints arising from materials and labour shortages paused the upswing in the residential construction cycle. In Q3, private sector residential work came in flat for the second quarter in succession. New home building went backwards for the first time in a year in Q3 (-0.8%) but was attenuated by a re-acceleration in alteration work (6%).  

Business investment — The rebound in the capex cycle from the COVID recession was setback by the Delta lockdowns. Capex contracted by 2.2% in Q3, its first quarter-on-quarter decline in a year. The weakness was centred in equipment capex (-4.1%q/q) as the lockdowns delayed spending, with the outturn potentially accentuated by the global supply chain pressures.  

Public demand — Spending by governments at the federal and state levels accelerated in Q3 (3.6%q/q) as the rollout of Covid-19 vaccines was stepped up.  

Inventories — Inventory levels fell in the quarter amid the constraints in global supply chains and the weakness in demand conditions associated with the domestic lockdowns.

Net exports — A sizeable contribution to Q3 GDP of 1ppt will come from net exports. Export volumes were up 1.2%q/q supported by a rebound in resources exports. Pressures in global supply chains and the lockdowns drove a 4%q/q contraction in imports. 

Wednesday, November 24, 2021

Australian Capex -2.2% in Q3; 2021/22 investment plans $138.6bn

Australian private sector capital expenditure contracted by 2.2% in Q3, with the Delta lockdowns disrupting the momentum of the earlier upswing. However, this looks to be a temporary setback with firms materially upgrading investment plans through the remainder of 2021/22. 

CapEx — Q3 | By the numbers
  • Private sector capex fell broadly as expected contracting by 2.2% to $32.7bn in Q3 (prior: 3.4%q/q revised from 4.4%q/q). Growth through the year lifted to 12.9% from 11.7% on base effects.
  • Equipment, plant and machinery capex declined by 4.1%q/q to $15.8bn (prior: 2.7%q/q), easing growth over the year to 17.4% from 18.9%. 
  • Buildings and structures capex was broadly flat (-0.2%q/q) at $16.9bn in Q3 (prior: 4.2%q/q), to be up 9% over the year (from 5.5%). 


  • Forward-looking investment plans for 2021/22 increased to $138.6bn according to estimate 4, representing an upgrade of 8.7% on estimate 3, and are on track for a year-to-year rise of 19.7%. 

CapEx — Q3 | The details

The rebound in Australia's capex cycle from the COVID recession suffered a setback in Q3 due to the Delta lockdowns. Capex was down 2.2% in Q3, its first quarterly fall in a year, but this weakness looks to be temporary in my assessment and the earlier momentum can be expected to re-establish itself in Q4 with locked down states opening up. As a result of Q3's contraction, capex fell back to $32.7bn to be broadly in line with pre-pandemic levels.  


Unsurprisingly, the national decline in capex was driven by New South Wales in response to the Sydney lockdown, which restricted trading conditions and impacted construction work. Capex in the state was down 8.5% in the quarter, knocking around $0.9bn off the national aggregate. Victoria also experienced an extended lockdown in Q3, though capex there was down a relatively modest 1.6% for the period. The ACT lockdown led to a 16.7% contraction in capex, though it accounts for just a fraction of national capex. 


Consistent with lockdown effects, the fall in Q3 capex was driven by the non-mining sector (-3.4%). Mining sector capex was resilient (1.2%) but it remains around the levels seen in recent years and is not expanding at any notable rate despite the surge in commodity prices. 


Within the non-mining sector, equipment spending fell for the first time since Q3 2020, down 4.6% in Q3. This component has been the major impulse for the rebound in the capex cycle, so its progress has been setback by the Delta disruptions and it will deliver a significant hit to the Q3 GDP figures. There may have also been an element of supply chain disruptions coming through in the quarter. In particular, the monthly trade accounts have reported a sharp fall in auto imports as production has been hit by the global semiconductor shortage. Buildings and structures spending by the non-mining sector was down 1.9%q/q, reflecting the temporary suspension of construction work in Sydney.


Taking a look at capex across the broad sectors of the economy, both the goods-related (ex-mining) (-3.4%) and business services sectors (-5.5%) saw heavy falls in capex in Q3. The former was hit by a 14.6% contraction in retail capex in response to the closures that occured in the industry through the winter lockdowns, while the latter saw broad-based falls as spending was temporarily delayed and as many people were working from home. Household services capex was neutral (0.5%q/q) around varying lockdown effects. Other services capex fell 16.2%q/q and education and training was down 7.3%q/q but health care capex surged by 10.2%. Arts and recreation surprised (20.9%q/q), supported by the states not affected by lockdowns.       


Turning to the forward-looking investment plans, the news here was positive and is the main reason why the weakness seen in Q3 appears to be a temporary setback. Expectations were for only a small upgrade in 2021/22 spending plans on the basis that firms may be delaying new investment amid the Delta lockdowns. However, in the preview, I put forward the view that there would be an upside surprise, with firms effectively upping investment plans through the remainder of the financial year as a response to an expected strong rebound in the economy and to make up for the disruptions in Q3. 

This is what transpired with firms' 4th estimate of 2021/22 investment plans lifted by 8.7% on the previous estimate to $138.6bn. A comparison with the equivalent estimate for 2020/21 has capex on track for a 19.7% year-to-year rise. Looking into the details, non-mining investment plans were increased by 10.3% on estimate 3 to $96.8bn, the highest 4th estimate on record to be running 22.3% higher year to year. Within this, equipment spending plans lifted 15% on estimate 3 (26.3% year to year) and buildings and structures were advanced by 6% (18.5% year to year). Mining capex plans for 2021/22 were up 5.1% on estimate 3 and up 14.1% year to year, with upgrades of similar magnitudes seen for equipment and buildings and structures. Plans here may be accelerating due to the very strong global demand for commodities. 


CapEx — Q3 | Insights

The rebound in the capex cycle was disrupted by the Delta lockdowns as overall business investment contracted broadly as expected in Q3 falling by 2.2%. The fall was centred in equipment spending (-4.1%q/q) and in the non-mining sector in particular (-4.6%q/q), which will result in a sizeable hit to quarterly GDP. However, this weakness should be temporary as investment plans for 2021/22 were upgraded sharply, consistent with the upbeat detail in recent business surveys. The resumption of the earlier rebound in capex, I expect, will be a key contributor to sustaining the economic expansion through 2022 as reopening effects fade.