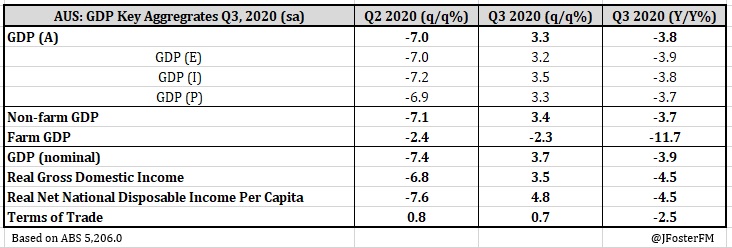
The Australian economy rebounded by 3.3% in the September quarter in what were the early phases of the reopening from its Covid-19 shutdown. This result was stronger than expected (2.5%) and moderated the decline in annual real GDP growth to -3.8% from -6.4%. Over the first half of the year, the domestic economy contracted by 7.3%, which incorporates the historic 7.0% fall in the June quarter as the full scale of the disruption from the shutdown hit and a modest 0.3% decline in the March quarter. These outcomes leave Australian GDP around 4.2% lower than its pre-pandemic level at the end of 2019.
Relative to what has occurred in Australia, larger declines in GDP were recorded over the first half of the year in economies offshore where virus outbreaks were more severe, restrictions on activity were tighter and shutdowns stayed in place for longer. The subsequent rebounds in GDP in Q3 have been largest in these economies as they reopened, though a resurgence in the virus has since derailed progress in the recovery in Europe and the UK as shutdowns have been reinstated, while in the US the risks to the outlook have increased as the case count has exceeded earlier highs.
From mid-May, the reopening of the Australian economy commenced through a gradual easing of restrictions in most states after the earlier containment measures had slowed the infection rate considerably. However, by late June to early July, a noticeable rise in virus cases emerged in Victoria, though they remained contained in the other states. In response, the Victorian authorities incrementally tightened restrictions and this broadened out to a statewide shutdown by August. Stringent containment measures then remained in place in Melbourne until late October but were phased out a little earlier in regional Victoria. This came against an easing trend in activity restrictions across the other states, though restrictions on interstate travel were tightened over the period.
Responding to these developments, mobility indicators in Melbourne rolled over from July and then remained at a much lower level than in the other capital cities over the September quarter. Mobility in Sydney appeared to slow in line with the developments in Melbourne before recovering over August and September, while the other capitals remained around a consistent level through the quarter, though still well below where they were before the onset of the pandemic.
As the reopening took shape, conditions in the labour market rebounded quickly, though the recovery remains incomplete and the progress has been uneven across industries and the nation more generally. Employment in Victoria weakened further on its return to shutdown but it improved across the rest of the nation as the easing of more restrictions led to an increased level of economic activity. Hours worked in the Q3 national accounts was reported to have rebounded by 4.5% across the economy, but the level is still around 7% lower than before the onset of the pandemic. A high unemployment rate (7% in October) and elevated spare capacity more broadly are the damaging legacies to the economy this pandemic has inflicted.
The 3.3% rebound in GDP growth in Q3 is a good start to addressing this situation. Driving this was household consumption bouncing back as opportunities to engage in activity and spend became more widely available on the reopening, most notably in services areas. It also reflected the powerful tailwinds generated by a very significant policy response. On the fiscal side, the ABS reports that $71bn in JobKeeper payments (Federal Government's wage subsidy) have flowed to households since its introduction, while an additional $34.6bn in support measures have been provided to businesses. The measures in the recent Federal Budget confirm support will be around 7% of GDP in 2020/21, with the focus being on stimulating private sector demand through bringing forward tax cuts, encouraging investment and boosting infrastructure spending. On monetary policy, the RBA has recently stepped up its response, lowering its interest rates structure to 0.1% and introducing a $100bn quantitive easing program at its November Board meeting. The ongoing fiscal and monetary policy support will be important in helping the economic recovery amid what is still a very uncertain outlook, while encouraging news around the development of vaccines offer optimism that there is light at the end of the tunnel.


— — —
GDP — Q3 | Expenditure: GDP (E) 3.2%q/q, -3.9%Y/Y
Household consumption (7.9%q/q, -6.5%Y/Y) — A strong rebound in household consumption of 7.9% on the reopening of the economy was the main theme in the September quarter, contributing 4ppts to GDP growth. During the shutdown-impacted Q2, household consumption collapsed by 12.9% as spending opportunities were limited by the activity and mobility restrictions. But even after Q3's rebound, household consumption is still 6.8% below its pre-pandemic level.
The areas of consumption that drove the rebound were those that were hit hardest by the restrictions as the pandemic emerged. After plunging by 17.9% in Q2, services consumption lifted by 9.8% in the September quarter reflecting very strong increases across transport (includes travel) (50.7%), hotels, cafes and restaurants (49.7%), health (26%), other services (23.4%) and recreation and culture (12.8%). Goods consumption also rebounded after a weak Q2 with a 5.2% rise where strength in clothing and footwear (21.8%) and new vehicles (15.4%) was notable.
Household income continued to be bolstered by fiscal support measures. ABS analysis reports that $35.8bn in JobKeeper payments was channeled through to households in Q3. In addition to this was the rebound in hours worked in Q3 (4.5%). These factors were key to driving a 3.3% lift in real household disposable income that extended on Q2's 3.5% rise, elevating the pace of annual growth to a near 12-year high (7.6%). After the household saving ratio soared to its highest level since the mid-1970s in Q2 at 22.1%, this declined by 3.2ppts to 18.9% as people made use of some of the funds they had accumulated during the shutdown. But with the level of saving still very elevated and with labour market conditions improving, household balance sheets appear in good shape to withstand the eventual tapering of fiscal support measures.
Dwelling investment (0.6%q/q, -7.6%Y/Y) — Residential construction posted its first quarterly rise in activity — albeit modest at 0.6%q/q — since Q2 2018, though it is still down by 7.6% through the year. Whereas new home building (-2.1%) extended its run of weakness out to a 9th consecutive quarter, alteration work came through with a 5.1% rise helped by the return to work after a weak Q2 (-5.5%) as well as the support from the Federal Government's HomeBuilder scheme that offers grants for substantial house renovations that meet certain criteria. Meanwhile, ownership transfer costs — relating to fees associated with real estate transactions — rebounded sharply (21.4%q/q) as restrictions that had impacted the residential property market were rolled back, this by itself added 0.3ppt to growth in Q3.
Business investment (-4.1%q/q, -9.2%Y/Y) — Going into 2020, business investment was already weak and this has since been accentuated by the onset of the pandemic as firms have responded to a highly uncertain economic outlook by cutting back to preserve liquidity. After Q3's 4.1% fall, business investment is 8.6% lower than its pre-pandemic level. Non-dwelling construction recorded a sharp 7.4% contraction in the quarter (-9.3%Y/Y), while machinery and equipment demand also pulled back noticeably (-3.2%) to be 11.6% lower through the year. The recent ABS Capital Expenditure survey pointed to a less pessimistic assessment of forward-looking investment plans and measures from the recent Federal Budget should help, but the outlook remains challenging.
Public demand (1.8%q/q, 6.2%Y/Y) — Helping to moderate the impact of weakness in the private sector on the economy over recent years has been public demand and this continued in Q3, rising overall by 1.8% to be up by 6.2% through the year. Public spending lifted by 1.4% (7.8%Y/Y), while underlying investment rebounded by 3.3% from a weak Q2, though it has been broadly flat over the past year (-0.5%).
Net exports (-1.9ppts in Q3, -0.8ppt yr) — The ongoing effects of the pandemic continue to impact trade flows significantly. Net exports were a drag on activity in the quarter, with the 1.9ppt subtraction to GDP being its largest in 40 years. Import volumes rebounded by 6.5% on the reopening as demand for consumption and capital goods improved, but exports fell (-3.2%) under the weight of the travel restrictions on overseas arrivals and weakness in the global economy.
Inventories (0.8ppt in Q3, 0.3ppts yr) — After being run down sharply over the first half of the year, inventory levels still declined in Q3, though at a greatly reduced pace and this was reflected by a sizeable contribution to activity in the quarter.
— — —
GDP — Q3 | Incomes: GDP (I) 3.5%q/q, -3.8%Y/Y
The real GDP income estimate lifted by 3.5% in Q3 after falling by 7.2% in the June quarter as the decline through the year improved to -3.8% from -6.7%.
Nominal Australian GDP was coming off its largest quarterly contraction on record in Q2 (-7.4%) as the shutdown hit employee and business incomes hard. While the reopening generated a 3.7% rebound in the quarter, national income is still some 3.7% lower than its pre-pandemic level.
Attenuating the shock has been the very significant level of income transfers from the public sector to businesses and households. Reflecting this, nominal total factor income (GDP (I) minus taxes less subsidies) has advanced by 7.6% over the past two quarters as nominal GDP has fallen by 4% over the period.
The nation's terms of trade had another subdued quarter lifting by 0.8%, which kept the annual pace little changed at -2.5% from -2.6%.
Business profits continue to be boosted by significant fiscal support with ABS analysis placing this at $57.6bn in Q3, incorporating $35.8bn from the JobKeeper policy and $13.4bn through the 'Boosting cash flow for employers' measure. Private sector company profits (ex-financial corporations) increased by a further 3.8% in the quarter (18.2%Y/Y) after surging up by 18.7% in Q2. Small businesses have been the primary beneficiaries of the fiscal support measures, with gross mixed income extending Q2's 22.2% surge with a 6.8% rise that has elevated growth through the year to 30.1%. Financial corporations operating surplus lifted by 0.8% in Q3, and while this improved the pace through the year from 0.6% to 1.1% growth is subdued as low rates continue to place pressure on interest margins.
Incomes from wages and salaries rebounded by 2.3% in Q3 to unwind the decline in the June quarter (-2.3%), with the pace through the year firming to 1.4% from 0.2%. The lift in wages was notably lower than the rise in hours worked across the economy (4.5%).
— — —
GDP — Q3 | Production: GDP (P) 3.3%q/q, -3.7%Y/Y
The production estimate for GDP in the September quarter came in at 3.3%, with the contraction through the year moderating to -3.7% from -6.3%. The clear narrative that came through was the rebound in the services sector that occurred on the reopening of the economy after being hit hard by the earlier restrictions. After contracting by 8.6% in Q2, gross value added by industries in the services sector lifted by 5% in the September quarter, though it is still 4.6% below its pre-pandemic level. By comparison, goods-related industries saw gross value added rising by 2.1% after falling by 6.5% in Q2, with the level now 4.7% below its pre-pandemic baseline.
On the services side, household services lifted by 8.8% in Q3 (-3.9%Y/Y) reflecting the reopening of accommodation and food services (41%q/q) and the return of face-to-face appointments and elective surgeries in the health sector (9.1%). Business services advanced by 2.4% in Q3 (-4.0%Y/Y) as activity in real estate (7.7%) and professional services (2.5%) came back online.
For the goods-related sector, the recovery was centred on industries in goods distribution where retailers (5.6%), wholesalers (4.7%) and transport firms (4.7%) saw demand conditions pick up on the reopening. The goods production sector was held to a modest 0.8% lift in Q3 as a decline in mining (-1.7%) attenuated rebounds from manufacturing (4.0%) and construction (2.2%), with the latter likely restrained by the shutdown in Victoria.
— — —
GDP — Q3 | Prices
The disinflationary impact on the economy following the onset of the pandemic eased in the September quarter due to the reopening. Coming after a 0.5% fall in Q2, economy-wide inflation based on the GDP deflator lifted by 0.4% in Q3, though the annual pace slipped into contraction (-0.1%) due to a base effect. Adjusting for the terms of trade impact on prices, the gross national expenditure deflator rebounded partially in Q3 (0.3% from -0.6%), with the level a touch softer over the year at 0.8%.
The household consumption deflator — the closest proxy in the national accounts to the Consumer Price Index (CPI) — was near flat in the quarter (0.1%) and is just 0.5% higher over the year to be at its weakest since Q1 1999. This is close to the CPI (seasonally adjusted) that came in at 0.7%Y/Y in the September quarter.
— — —
GDP — Q3 | Productivity
Hours worked across the economy collapsed over the first half of the year (-11%) as the pandemic emerged and restrictions came on, with the decline in the market sector (excludes the public sector) even more severe (-13%). In this context, the rebounds in Q3, while sharp in isolation, show that the recovery has a long way to go with hours worked overall up 4.5%q/q and 5.3%q/q higher in the market sector.
As the increase in hours worked was faster than the rise in output, GDP per hour worked was mechanically pulled lower (-1.1%) in Q3 (3.1%Y/Y). Meanwhile, GDP per capita rebounded by 3.2% in the quarter, but it remains sharply lower through the year (-4.7%) and on its pre-pandemic level (-4.8%) reflecting the hit to productivity from the shutdown and restrictions.
— — —
GDP — Q3 | States
The divergence in the reopening story was evident in the state demand figures as Victoria re-entered shutdown mode while the recovery across the rest of the nation progressed. State demand in Victoria contracted by 1.0% in Q3 (-9.8%Y/Y) following Q2's 8.5% collapse as well as a 0.3% decline in Q1. As it stands, Victorian state demand has contracted by 9.7% from its pre-pandemic level. With the shutdown in effect, the declines were broad based with business investment plunging (-11.3%) and household consumption (-1.2%) and residential construction (-1.0%) pulling back, though some moderation came through from public demand (3.5%).
In New South Wales, state demand lifted by 6.8% in Q3 (-3.3%Y/Y) as household consumption (10.8%) soared coming out of the shutdown. Residential construction (2.7%) also benefitted from the reopening as well as policy stimulus posting its first quarterly rise since Q2 2018. However, business investment (-2.4%) weakened for a third straight quarter and has contracted by 8.8% through the year. Public demand remains supportive (2.2%9/q and 6.5%Y/Y), though this centres on spending after the investment side has softened over 2020.
Across the other states, Queensland was best performed as state demand lifted by 6.8% in Q3 (0.7%Y/Y) coming predominantly from an 11.6% rebound from household consumption, though residential construction (2.4%) also contributed to the reopening effort. In South Australia, state demand posted a 6.7% rise (-0.8%Y/Y) as household consumption lifted by 11.0%. Public demand advanced modestly (1.7%) but was more than offset by contractions in residential construction (-3.3%) and business investment (-0.9%). Western Australian state demand was up by 4.9% in Q3 (-0.7%Y/Y), with household consumption there recording the fastest rebound in the nation (11.7%). But business investment has rolled over since the onset of the pandemic (-0.5%Y/Y) and residential construction (-17.2%) has been weak for some, though recent government incentives are having an effect and should alter the course. Tasmanian state demand increased by 5.5% in Q3 (-3.2%Y/Y) on a household consumption-led recovery (10.6%). But this was attenuated by weakness in the other components with residential construction -2.1%, business investment -0.1% and public demand -1.1%.