Independent Australian and global macro analysis

Wednesday, December 4, 2024

In review: Australian Q3 GDP - Households remain on sidelines

Subdued growth has persisted in the Australian economy. Real GDP growth missed to the downside in the September quarter expanding by 0.3% (vs 0.5% forecast), easing from 1.0% to 0.8% through the year. An expected rebound in household consumption failed to materialise in Q3 - fiscal support measures were unable to break the malaise caused by cost-of-living pressures and higher interest rates. Excluding the Covid period, annual growth is tracking at its slowest pace since the recovery from the early 1990s downturn. RBA rate cuts are back on the radar for early 2025, with the RBA's forecast for 1.5% GDP growth by year-end now unlikely to be met. 


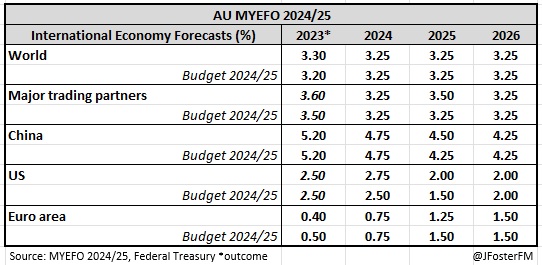
The global growth backdrop remained a headwind for Australia. Major central banks have responded to weaker growth by easing monetary policy, including in the US where growth has been notably stronger. Lacklustre growth in China has weighed on commodity prices, hitting Australia's terms of trade by a further 2.5% in the quarter. 


In Australia, public demand has held the keys to growth as the effects of higher interest rates and cost-of-living pressures have weighed on consumption and investment, reflected in private demand slowing sharply. Robust growth in public demand (4.1%Y/Y) has been driven by government spending on household support and in health and aged care programs, and investment in renewable energy and transport infrastructure. 


The main dynamic remains around households. Although inflation has cooled significantly since peaking in late 2022, weakness in household consumption continues given the earlier period of historic real income declines. Real incomes are now rising, but this will take some time to translate into consumption. This is ultimately key to how economic growth performs relative to the RBA's forecast trajectory. 


Fiscal support from electricity bill rebates and the Stage 3 tax cuts were welcome developments for households in Q3. However, restrictive interest rates are largely offsetting those tailwinds. Mortgage interest and tax payments as a share of gross disposable income fell only modestly in the quarter and remained elevated at around 21%. 


Amid the global easing cycle, the RBA has remained a hawkish outlier holding the cash rate at 4.35% since November 2023. Recent communications have highlighted that the Board remains vigilant to upside risks to inflation from weak productivity growth - reported at a -0.7%Y/Y pace in Q3 - feeding into its overall judgement that demand is exceeding supply. However, given the slowing in inflation and growth looking to be tracking below the RBA's forecast trajectory, the prospect of the Board starting to ease rates in early 2025 is back on the radar. 


— — 

National Accounts — Q3 | Expenditure: GDP (E) 0.3%q/q, 0.5%Y/Y


Household consumption (0.0%q/q, 0.4%Y/Y) — After contracting by 0.3% in the June quarter, expectations for a stimulus-driven rebound in household consumption fell flat in the September quarter (0.0%). Growth through the year remained at a weak 0.4% - its softest momentum since the pandemic and prior to that the global financial crisis. 


During Q3, households received fiscal support as the Stage 3 tax cuts came into effect and from federal and state government rebate schemes on electricity bills. Incomes continued to be underpinned by robust labour market conditions - and with tax relief flowing through, gross disposable income picked up to rise by 1.5% across the quarter and 6% through the year.


With inflation cooling - the household consumption deflator saw its slowest quarterly rise in 3 years (0.7%) to decline from 4.4% to 3.6% at an annual rate - real disposable income lifted by 0.8% in Q3 to be up 2.4% over the year - its fastest pace since Q2 2022. The soft result for consumption growth in the context of rising real incomes indicates that cautious households largely saved the extra cashflow freed up by the Stage 3 tax cuts and electricity rebates. Accordingly, the saving ratio lifted from 2.4% (revised up materially from 0.6%) to 3.2% - its highest since late 2022. 


The consumption basket of households remains weak in the discretionary-related category (0.1%q/q, -1.1%Y/Y), with non-essential purchases continuing to be scaled back amid cost-of-living pressures and higher interest rates. However, strong demand for overseas travel to Europe in the northern summer and for the Paris Olympics supported consumption growth. Essential consumption declined slightly in Q3 (-0.1%q/q), although this was mainly due to the treatment of the government subsidies, recorded as lowering household spending on electricity (-16.7%q/q). Categories such as rents, health, and dwelling services have underpinned a 1.5% lift in essentials consumption over the past year.  


Dwelling investment (1.2%q/q, -0.5%Y/Y) — Lifted by 1.2% in Q3 - its sharpest quarter-to-quarter rise since Q1 2021 - but the level of activity remained down on a year ago (-0.5%). Higher interest rates and legacy issues from the pandemic around capacity pressures remain headwinds to the home building sector. That said, the intensity of these headwinds may be fading. New home building increased by 1.7% in Q3 following a 1.3% rise in the previous quarter, turning annual growth positive (0.8%) for the first time in a year. Alteration work saw a modest rise (0.4%) amid a broader retracement from high levels of activity reached during the pandemic.  


Business investment (-0.2%q/q, 1.5 %Y/Y) — The post-Covid slowdown in business investment continued to the point of contracting in the September quarter (-0.2%). Annual growth slowed from 3.0% in Q2 to 1.5% in Q3, down substantially from a robust 7.5% pace a year ago. Economic uncertainty, higher interest rates and elevated construction costs have all played a role in this slowdown. Declining business investment in Q3 was driven by non-dwelling construction (-1.7%), a component that has been supported by data centres and renewable energy infrastructure. Equipment investment lifted 0.6%q/q but has fallen modestly across the year (-0.7%). 


Public demand (2.2%q/q, 4.1%Y/Y) — Expand by a robust 2.2% in Q3 - its fastest quarterly rise since Q1 2022 - to be up by 4.1% through the year, directly adding 0.9ppts to overall growth - the largest contribution of all expenditure components. Public demand continued to provide countercyclical support to the economy amid slowing private demand. Government expenditure increased by 1.4% in Q3 (4.7%Y/Y) driven by federal and state government electricity rebate schemes. New investment (6.1%q/q) saw its fastest acceleration for 6 years on initiatives across a range of portfolios including roads, hospitals, renewable energy and defence.  


Inventories (-0.4ppt in Q3, -0.1ppt yr) — Subtracted 0.4ppt from quarterly growth following a 0.3ppt deduction in Q3, weighing modestly on growth over the past year (-0.1ppt). Private non-farm inventory levels declined in Q3 (-$2bn) as weak demand saw the retail industry looking to run down inventory overhangs, while mining inventories fell as exports increased by more than production. 


Net exports (0.1ppt in Q3, -1.0ppt yr) — Added a modest 0.1ppt to GDP growth for the second quarter in succession. Over the past year, net exports have been a headwind to growth (-1.0ppt) as the post-pandemic recovery in domestic tourism has wound down and imports have been supported by overseas travel. 


In Q3, exports were broadly flat rising by 0.2%, with a 0.9% lift in goods offsetting a 3.6% fall from services - the third decline in the previous 4 quarters. Goods exports were underpinned by a surge in coal exports (8.2%) - the strongest increase in more than a year on an uplift in demand for thermal coal from Asia - driving resources exports to a 1.7% rise, notwithstanding falls in iron ore (-1.4%) and LNG shipments (-2.5%). Lower numbers of overseas student arrivals - partly reflecting tightened visa conditions - continued to weigh on services exports. 

Imports eased by 0.3% in the quarter as a decline in goods (-1.5%) outweighed strength from the services sector (3%). Vehicle imports fell sharply (-13.2%) on reduced demand for electric vehicles, while fuel imports contracted (-4%) as oil producing countries curbed production in an oversupplied market - both components hitting goods imports. By contrast, services imports accelerated at their fastest pace in a year driven by strong demand for travel to Europe for the northern summer and the Paris Olympics.   

— — 

National Accounts — Q3 | Incomes: GDP (I) 0.4%q/q, 0.9%Y/Y 


The backdrop for incomes was challenged in the September quarter by weakness in global economic growth and declining commodity prices. Falling demand for iron ore and metallurgical coal in China weighed on the prices of these bulk commodities, driving a 2.5% decline in the terms of trade in Q3 - the index down 4% over the past year and 17.2% below the record highs of mid 2022. 


Over the period since mid 2022, nominal GDP growth in annual terms has slowed from 12.6% to 3.5% - the falling terms of trade and slowing inflation being the key drivers. 


In the September quarter, the income estimate of GDP was 0.4%; growth through the year eased from 1.0% to 0.9% - its slowest pace outside the Covid period since the early 1990s recession.  


Looking at corporate profits, private sector non-financial corporations gross operating surplus contracted by 3.9% in Q3, down 5.1% through the year. The key dynamic has been falling mining sector profits in response to the retracement in commodity prices. Meanwhile, margin pressures - from softer demand and higher costs - have weighed on profitability across the non-mining sector of the economy, as well as on small businesses with gross mixed income soft (-1.2%q/q, 0.8%Y/Y). By contrast, financial corporations gross operating surplus continued to rise at a solid pace (1.1%q/q, 5.3%Y/Y), with higher interest rates bolstering net interest margins.


Robust labour market conditions continued to support wage incomes. Compensation of employees (CoE) lifted by 1.4% for the quarter, rising by 2.0% in the public sector and 1.2% in the private market. Annual growth in CoE slowed from 6.4% to 5.4%, falling on base effects from larger pay increases in Q3 last year.    


Growth in non-farm unit labour costs - a key focus for the RBA - was 0.6% in nominal terms in the quarter; the annual rate slowed from 5.1% to 3.9%, its weakest pace outside the pandemic since late 2019. In real terms, non-farm unit labour costs were running at 0.6%q/q and 1.6%Y/Y, continuing on their slowing trajectory since the middle of last year. Overall, wage-driven inflationary pressures are easing.  


— — 

National Accounts — Q3 | Production: GDP (P) 0.3%q/q, 1.1%Y/Y

The GDP production estimate came in at 0.3% quarter-on-quarter and 1.1% year-on-year, both outcomes unchanged from the June quarter. In terms of their relative contributions to overall growth, the services sector continues to outperform the goods sector. 


Gross Value Added (GVA) in the services sector lifted by 0.4% in Q3 to be up by 1.3% through the year. Household services (0.9%q/q, 1.3%Y/Y) have led the way. Within this, arts and recreation (2.4%q/q) advanced on attendances at major sporting events, while healthcare (1.2%q/q) was supported by demand for allied health and GP services. Business services were flat in the quarter but up 1.4% year-on-year. Key gains came through in financial services (0.9%q/q) and telecommunications (1.2%q/q), but there were offsetting declines in professional services (-1%q/q) and administration (-1%q/q). 


In the goods sector, GVA was soft in Q3 (-0.3%) and over the past year (-0.1%). Goods production declined by 0.3% for the quarter as disruptions impacted the mining industry (-0.8%) and weaker demand hit manufacturing (-0.8%). A 0.2% fall was seen in goods distribution; declines in transport (-0.9%) and wholesaling (-0.3%) more than offset a lift in retail trade (0.6%) on the back of increased demand for clothing and footwear.  

Tuesday, December 3, 2024

Australian GDP 0.3% in Q3

Expectations for a pick-up in Australian economic growth fell short of the mark as September quarter real GDP lifted by 0.3% against 0.5% forecast. Year-ended growth has moderated further from 1.0% to 0.8% - a low outside the pandemic since the early 1990s downturn. Household consumption was disappointingly flat (0%q/q) despite fiscal support measures and slower inflation boosting real incomes. Unless growth can accelerate in the final quarter of 2024, the RBA's forecast for 1.5% GDP growth by year-end is at risk. A February rate cut cannot be ruled out, particularly if the quarterly CPI data for Q4 (due late January) qualifies as a 'good' report that RBA Governor Bullock recently spoke about. 


The effects of higher interest rates and cost-of-living pressures have been major headwinds to growth in Australia. In response, private demand (0.1%q/q) - including household spending, residential construction and business investment - has slowed to annual growth of 0.7%, down from 2.5% a year ago. Public demand (2.2%q/q) has held the keys to growth over the past year, expanding at a robust 4.1% pace. Government spending has ramped - due to energy bill rebates and spending on health and aged care programs - while work on the large pipeline of infrastructure projects has also been a key support. Net exports (-1ppt) and inventories (-0.1ppt) have weighed on growth over the past year. 


Rising real incomes from slower inflation and fiscal support (Stage 3 tax cuts and energy bill rebates) were unable to generate a meaningful bounce in household consumption, the key dynamic in Q3. Real disposable income growth lifted 0.8% to a 2.4%Y/Y pace - its fastest in more than 2 years - but household consumption was flat in Q3 (after a downwardly revised 0.3% fall in Q2) and annual growth was unchanged at a weak 0.4%. Weakness in discretionary-related consumption (0.1%q/q, -1.1%Y/Y) suggests more time is needed for the real income story to gain traction; RBA rate cuts could also be a missing ingredient to spur households. A positive is that historical revisions have lifted the saving rate materially, which rose from 2.4% to 3.2% in Q3 - a high since Q4 2022, indicating households have more scope to spend than earlier estimated. 


More to come. 

Monday, December 2, 2024

Australia Current Account -$14.1bn in Q3; net exports +0.1ppt

Australia's current deficit narrowed slightly from a revised -$16.4bn in Q2 (-$10.7bn earlier reported) to -$14.1bn in the September quarter (vs -$10.8bn expected) but remains at wides going back to 2018. This sees the deficit running at just over 2% GDP, a sharp reversal from 3 years ago when the current account surplus hit a peak of 3.5% of GDP. The driving factor has been the terms of trade rolling over (-2.5%q/q, -4%Y/Y) as commodity prices have retraced from the elevated levels reached as the global economy recovered from the Covid shock. Net exports are estimated to add a modest 0.1ppt to quarterly GDP in tomorrow's National Accounts.  


The key movements in the September quarter were the trade balance reducing from a surplus of $6.5bn to $3.3bn, and the income deficit narrowing from $22.8bn to $17.3bn. The difference between the two (allowing for rounding) produces the result at the topline level of the current account deficit narrowing from $16.4bn to $14.1bn, the net outflow of capital from Australia to the rest of the world. 

Australia's trade balance - the difference between export revenue and import spending - was a surplus of $3.3bn in the quarter, its narrowest since Q2 2018. 

Export revenue fell 2.4% to $156.5bn, a decline of 5.9% over the year. Falling export revenue is largely a story of declining commodity prices, but there are economy-wide effects; national income takes a hit (lowering the tax base), with mining sector profits declining 16%Y/Y according to yesterday's data (see here). In the quarter, export prices were down a further 2.6%, contracting 4.9% year-on-year. Underlying export volumes were up a very modest 0.2% in Q3 - boosted by the strongest rise in resources shipments for more than a year (1.7%) - but down overall by 1.1% on a year ago. Services exports continue to weaken (-3.6%q/q, -5.7%Y/Y) on lower tourist and student arrivals.  


On the import side, spending was soft in the quarter (-0.4%) but rose over the year (1.7%) to $153.3bn. The underlying movements are mixed: import prices are easing (-0.1%q/q, -1.0%Y/Y) - declining fuel prices a key factor - while volumes were soft in Q3 (-0.3%) but up across the year (2.7%). At a more granular level, the ABS reported that goods import volumes (-1.5%) were down as oil producing countries responded to oversupply in the market by curbing production; however, services imports picked up (3.0%) led by travel to Europe for the northern summer and Paris Olympics. 


Overall, with export volumes up in Q3 (0.2%) and imports declining (-0.3%), net exports will make a positive contribution to GDP growth in the quarter - the ABS estimating a small 0.1ppt addition from this component. 


Australia's income deficit remained substantial in Q3 (-$17.3bn) but is well down from the peak in 2022 (-$31.9bn). In the latest quarter, there was a $5.5bn reduction in the deficit; returns to Australian investors in offshore equities advanced as dividends paid to foreign investors in local equities declined - impacted by weaker mining sector profits. Meanwhile, the spillover effects of global bond yields falling as central banks offshore cut interest rates (a move that has later reversed) saw debt interest paid by Australia decline. 

Australian dwelling approvals press 2-year high in October

Australian dwelling dwelling approvals rose 4.2% to a 22-month high of 15.5k in October, well clear of the 1.5% lift expected. Approvals were coming off a 5.8% increase in September (revised up from 4.4%) and have advanced in 7 of the past 9 months. Unit approvals (22.4%) spiked to drive the headline increase in October. The uptrend in detached house approvals was snapped by a 5% decline in October, pulling back after reaching a 25-month high in September. Higher interest rates and capacity pressures persist, but the intensity of those headwinds impacting the home building sector may be easing.


A 4.2% month-on-month rise saw headline dwelling approvals pressing 2-year highs in October. Volatility in unit approvals was positive in the month (22.4%), more than offsetting a fall in detached approvals (-5.0%) - just the 3rd month-on-month decline for the segment since the start of the year. 3-month approvals have risen to average 14.8k - their highest since early 2023 to be up from 13.1k at the lows for the cycle in March 2023. Detached approvals averaged 9.6k over the past 3 months, a high back to late 2022, while unit approvals remained at a low level averaging around 5.3k. 


The underlying detail in the report showed a sharp increase in high-rise approvals in October, largely coming through in Sydney and Melbourne. Townhouse and low-rise approvals also contributed to the strength in the higher-density segment. 


The value of alteration work approved remains elevated ($1.1bn) despite declining by 4.2% in October. Although the volume of alteration work has slowed from the peaks seen during the pandemic, the value of alterations has remained high, which reflects the pass-through of cost pressures faced by the sector. 

Sunday, December 1, 2024

Australian retail sales rise 0.6% in October

For the second time in the past 3 months, Australian retail sales have outperformed expectations after a 0.6% rise (vs 0.5% forecast) came through for October. Annual growth accelerated from 2.4% to 3.4%, a 17-month high. Discounting ahead of the Black Friday sales in November looks to have been the driving factor, with discretionary retail spending rising by 0.8% for the month. The Stage 3 tax cuts and electricity bill rebates could be gaining traction with households, consistent with the recent uptick in sentiment indicators. 


Headline retail sales lifted by 0.6% in October, rebounding from a slowdown in September (0.1%) that followed a strong gain in August (0.7%). Across this period, retail sales have averaged a 0.5% rise - its strongest momentum since November 2023.


The ABS reported that early discounting into the Black Friday sales was a key factor behind the October result. Electrical goods rose 2.7% - their strongest rise since January - on the back of discounting for TVs and AV equipment. This drove the household goods category to a 1.4% rise for October, underpinning a broader lift in discretionary (or non-food) sales (0.8%) amid falls in clothing and footwear (-0.6%) and department stores (-0.3%) - categories that should benefit through Black Friday. Online sales saw a 0.8% lift, but this was driven by food (2.7%) as non-food sales were flat.  


Sales were higher across the states in October. Annual growth is running either side of 4% in Victoria, Queensland and Western Australia, and 3% in South Australia and Tasmania. In New South Wales, sales are tracking a slower 2.4%yr pace; however, that is its fastest pace since May 2023, with the state also accounting for the largest share of national turnover (around 31%). 

Australian Business Indicators Q3: inventories -0.9%

Australia's business indicators series for the September quarter was weak across the key details of inventories, sales, and company profits. Domestic demand remains subdued weighed by cost-of-living pressures and higher interest rates. Soft demand, falling commodity prices and margin pressures are impacting company profits. Private non-farm inventories look to have cut 0.5ppt from GDP growth in the quarter, a downside surprise.  


Sales volumes lifted by just 0.2% in the September quarter after falling by 0.3% across the first half of the year. Demand in the consumer-facing sectors of retail (0%) and hospitality (-0.4%) is is weak; however, arts and recreation was up strongly (3.3%) - suggesting that households are still able to spend but are doing so more selectively. 

Declines in sales were notable in professional services (-1%) and manufacturing (-0.8%), while utilities also fell (-1.3%) - likely reflecting the impact of government subsidies on electricity bills. On a more positive note, construction advanced (1%) indicating supply and cost pressures could be easing, while a pick-up in mining (1.2%) should support exports (details due tomorrow). Telecommunications (1.3%) was also an area of strength.     


Inventories declined more sharply than expected contracting by 0.9% for the quarter (vs -0.1% forecast). Some of this can be attributed to the mining sector (-2%) as shipments to overseas markets rebounded, which will add to growth; but falls in retail trade (-1.4%) and hospitality (-4.4%) are consistent with demand weakness - potentially firms are turning to discounting to clear inventory overhangs. Overall, declining inventories are estimated to deduct 0.5ppt from GDP growth in Q3, with further details from the public sector due tomorrow. 


A range of headwinds is impacting company profits, which fell by 4.6% in the latest quarter to be down 8.5% through the year. On an inventory-adjusted basis (closer to the methodology used in the National Accounts), company profits contracted 3.9% quarter-on-quarter (-8.2%Y/Y). 

The driving factor behind declining profits is falling commodity prices, directly hitting the mining sector (-8.8%q/q, -16%Y/Y); however, non-mining profits are also under strain (-1.7%q/q, -2.8%Y/Y) from margin compression amid weak demand and input cost pressures. 


Growth in the wages bill lifted by 1.2% in the September quarter - its strongest quarter-on-quarter rise in a year - supported by robust employment growth and the 3.75% rise to award rates determined by the Fair Work Commission coming into effect. Annual growth, however, continues to slow, stepping down to 4% from a 5.4% pace through the year to Q2.