Independent Australian and global macro analysis

Thursday, November 8, 2018

Australian housing finance continues to slide

Australian housing finance continues to weaken, with data for September showing a further deterioration in both commitments and value. Tighter lending standards and declining property prices are major factors working towards damping sentiment and demand for housing finance.   

Housing Finance — September | By the numbers 

  • Housing finance commitments to owner-occupiers fell by 1% in September, in line with the market forecast, to 50,673 (August -2.2%) to be down by 9.7% across the year 
  • The total value of housing finance committed in September to both owner-occupiers (excluding refinancing) and investors fell by 3.7% (August -3.9%) to  $A23.008bn, which is a decline of 14.2% over the year
Click to expand charts

Housing Finance — September | The details 

Looking across the segments, the weakness was broad-based. The value of lending to owner-occupiers fell by 4.3% in the month to $13.257bn — the weakest level since September 2016  and has fallen by 11.1% over the past year. For investors, lending fell by a further 2.8% in September to $9.75bn — its weakest since mid-2013 — representing an annual decline of 18.1%. 

Lending to first home buyers fell by a sharp 9.7% in the month to $2.969bn, which is down by a more modest 2.8% on an annual basis. The value of refinancing commitments declined by 4.1% in September to $6.11bn to be little changed over the year (+0.6%).   


Over the September quarter, the value of housing finance posted its 4th consecutive quarterly decline, falling by 5% to $71.757bn. This is the sharpest quarterly contraction since Q1 in 2010, while the aggregated level is the lowest since Q2 2014. The decline in the September quarter was almost identical in magnitude for owner-occupiers (-4.9%) and investors (-5.0%).  

Finance approvals to fund the construction of property, or to purchase newly completed property, also continue to soften falling by 3.6% in September and by 16.5% on an annual basis. The decline has been sharper for approvals for newly constructed dwellings (-21%Y/Y) fitting with the slowing trend in recent building approvals data.   


The state-level data provided some interesting detail. Approvals to owner-occupiers are falling fastest in Victoria, with falls of 4.3% in the month and 12.8% on the year. In New South Wales the declines were 1% in September and -10.1% annually. 

For the other states, South Australia fell by 3.3% (-6%Y/Y), Queensland -0.1%m/m (-7.2%Y/Y) and Tasmania -0.9%m/m (+6.5%Y/Y). Western Australia recorded its 3rd consecutive monthly increase at 4.7%, though approvals are still down 9.2% on the year.

   
 Housing Finance — September | Insights 

With the continuing impact of tighter lending standards and property prices softening on a national basis, the demand for housing finance continues to slide. This is consistent with further declines in property prices, particularly in Sydney and Melbourne where owner-occupier finance approvals have fallen heavily over the past year  though, this will also help to improve affordability in those cities. 

With further property price declines likely, the key risk to the real economy is the extent to which consumer spending may be negatively impacted by declining wealth. The Reserve Bank of Australia has, in general, remained sanguine regarding those risks in their commentary, while also highlighting significant uncertainty around their outlook.  

Tuesday, November 6, 2018

RBA on hold: Growth outlook firms

As widely expected, the Reserve Bank of Australia (RBA) kept its benchmark interest rate on hold in November at 1.5% — the 25th consecutive meeting where no change has been the decision from the Board. 


There were, however, several key changes in the Governor's statement that accompanied today's decision compared to the previous meeting. Ahead of Friday's scheduled release of the RBA's quarterly Statement on Monetary Policy (SoMP), the Governor signaled that the Bank's forecasts for economic growth are to be revised up to around 3.5% in 2018 and 2019 from the previous estimates of 3.25%. 

This came despite no apparent change to the Bank's outlook for household consumption — the largest component of the domestic economy — which it maintained as uncertain given that income growth remains low, debt levels high and "some asset prices have declined", though specific commentary regarding property price declines was unchanged from last month.

On the labour market, the firming in the outlook for above-trend growth is now expected to drive the unemployment rate down to around 4.75% in 2020, which is a more upbeat assessment from last month where it had only expected a gradual decline in the unemployment rate to around 5% by 2020. However, stronger growth in wages is "still expected to be a gradual progress".    

Regarding inflation, today's statement highlighted that, as the RBA had expected, Q3's inflation data had softened following once-off impacts to prices — mainly in childcare — following changes in government policy. With these impacts now in the past, the Bank expects inflation will rise from its current pace of around 1.9% to 2.25% in 2019, which is in line with previous forecasts, but then anticipates a stronger trajectory than previously estimated in 2020.

Recent financial market volatility was noted by the Bank referencing declines in global equity markets and higher government bond yields. However, the Bank remains sanguine on the outlook for the real global economy with above-trend growth, low unemployment rates, and expansionary financial conditions.     

Friday, November 2, 2018

Weekly note (2/11) | End-of-month rally lifts markets

Risk aversion drove heavy declines in global equity markets in October, but it could have been worse as a rally towards the end of the month reduced the losses, with the optimism then extending into the start of the new month. 

In the US, the tech-heavy Nasdaq fell by 9.2% in October and the broader S&P500 lost 6.9%, although at their lows the declines were 12.4% and 9.4%, respectively. To round out the month, US markets posted back-to-back sessions where gains were in excess of 1% and this helped to lift markets in Asia and Europe off their lows. The issue for markets to ponder now is whether the lows are in, or if this proves to be transitory — only time will tell. For the moment, though, implied volatility on financial markets remains elevated, which has been reflected in some large intraday and daily moves, while the broader concerns relating to rising US interest rates, political uncertainties, the global growth outlook and trade still remain. 

In noting this, sentiment appeared to be lifted this week following conciliatory rhetoric from US President Trump regarding trade developments with China, though the detail was light. In a Tweet, President Trump said that meetings with China's Present Xi were being scheduled during Argentina's G-20 Summit later this month. Also helping to lift sentiment was a pledge from China that further stimulus measures were being planned to help ward off slowing economic growth. 


— — — 

It was a busy data calendar in Australia this week with several key updates released. The overall tone of the incoming data was titled to the soft side, though this did not come across as overly surprising and is therefore unlikely to alter the Reserve Bank of Australia's assessment of the domestic economy ahead of next week's meeting.     

First on the list was building approvals for September (click here for our analysis), which followed their recent easing pattern. Approvals are slowing across all types of dwellings — not limited to high-rise units — reflecting factors including tighter financing conditions, softening property prices and concerns regarding oversupply within certain markets. However, the volume of residential construction work currently underway is elevated so the impact of slowing approvals will take some time to work through to activity. 

Next up was the latest inflation data (see here), which was softer than expected at 0.4% on a headline basis in Q3 and 1.9% over the year. The quarterly inflation figure has now come in below expectations for 8-consecutive quarters. There were several once-off factors behind this result, with the most significant being a drag from childcare costs following changes to federal government subsidies. More importantly, core inflation — which is what the RBA analyses in policy decisions — appears to have lost momentum and has now run below the lower 2% target since December 2015. Following slow wages growth over recent years, the inflationary pulse remains soft in Australia. What inflationary pressures there are have mostly been limited to areas where pricing is influenced by government policy   such as utilities costs, childcare, private health insurance premiums etc  as opposed to market-based forces.

Credit growth to the private sector broadly matched expectations in September but has been moderating this year. Of particular note, credit growth for investment housing eased to an annual pace of just 1.4% — its slowest pace on record. Also on housing, CoreLogic's Home Value Index showed property prices declined by 0.6% on a national basis in October to be down 4.6% over the year. Sydney has led that decline, with prices down by 7.4% across the year.

The most positive data this week was September's update on international trade (see here). Australia's trade surplus exceeded $3 billion in the month blitzing market expectations for a result a little more than half that figure. Surging iron-ore prices were the main factor together with support from stronger LNG prices, which will provide a boost to national income in Q3's National Accounts, and feature as our chart of the week.         

Chart of the week 


Rounding out the week, retail spending slowed in September (see here) rising by just 0.2% in the month, with clear weakness in the discretionary areas of spending. While labour market conditions have been strengthening, there have been broader concerns relating to the outlook for household spending given slow wages growth, softening property prices and, as highlighted earlier from the inflation data, strong price increases in areas such as utilities. This will remain a key area of focus for the RBA.  

Thursday, November 1, 2018

Australian retail spending slows in September

Growth in Australian retail spending was slower than expected in September, while sales volumes — which adjust nominal spending for changes in prices — also disappointed forecasts providing an early signal of a lower contribution from the household sector towards economic growth in the third quarter. 


Retail Trade — September | By the numbers 

  • Growth in retail spending increased by 0.2% in September to $A26.893bn, which was below the median forecast for a 0.3% rise. Turnover growth in August was 0.3%. 
  • Annual growth in spending was unchanged, after allowing for revision, at 3.7%    
Click charts to expand


  • Retail sales volumes growth slowed to 0.2% in Q3 (from a revised pace of 1% in Q2), which was softer than the 0.4% increase expected by markets.
  • In annual terms, volume growth eased from a revised 2.4% pace to 2.2% 

Retail Trade — September | The details 

Analysis of September's data highlights the soft nature of this update. Total retail spending increased by just 0.2%, or $43.7m, to $26.893bn. That increase was driven by spending on food, which increased by 0.4%, or $47.1m, to offset weakness in the discretionary areas of consumer spending. Removing the impact of food sales, discretionary retail spending growth was flat in September. 

Across the categories, spending declined in September on clothing and footwear (1.2%), while growth was flat for household goods, department stores, and 'other' retailing (pharmaceuticals, books and stationery etc). There was, however, a 0.5% increase in spending in cafes, restaurants and takeaway food. These trends were also largely evident over the quarter. 

     
Looking across the states, sales growth was subdued in September led by Tasmania (+0.8%), which accounts for only around 2% of national retail spending. Next best was Victoria at +0.7% (around 26% of national spending). There was modest growth in Queensland (+0.4%) and South Australia (+0.3%), while Western Australia was flat. Spending in New South Wales, which accounts for the largest share of national retail spending, declined by 0.4% — its sharpest monthly fall since December last year.    

Spending growth over the quarter was also led by Tasmania (+1.3%), followed by Victoria (+1%), Queensland (+0.9%), South Australia (+0.7%), New South Wales (+0.5%). Western Australia saw a 0.7% fall in Q3.  


Turning to volumes, which reflects quantities of goods sold, there was broad-based weakness in the quarter, with; department stores -0.8%, household goods -0.7%, and clothing and footwear -0.6%, while food was unchanged. Increases in 'other retailing' (+2.2%) and cafes, restaurants and takeaway food (+1.2%) were enough to drive the overall rise in volumes of 0.2%.

Retail prices, which can impact sales volumes, remain subdued rising by 0.4% in Q3 to be up by just 1.2% across the year. Food prices drove this result with a 0.7% rise. Cafes, restaurants and takeaway food lifted by 0.5%, while clothing and footwear rose by 0.3% — its first quarterly price increase since March 2017. Discounting, however, remains in department stores (-0.2%) and household goods (-0.3%).   


Retail Trade — September | Insights 

This was a soft update with both spending and volumes coming in below expectations. Given that volume growth was strong in Q2 at 1% a softer outcome this quarter is not overly surprising. However, annual growth in volumes has largely tracked sideways over the past year or so despite weakness in prices. Likely factors weighing on retail demand are slow wages growth, softening property prices and strong price rises from non-discretionary areas such as utilities, fuel, and private health insurance premiums. 

Overall, household consumption holds the key to the outlook for growth in the domestic economy. While retail sales account for around 30% of total household consumption, with spending on services covering the balance, it does provide an early indication for a softer contribution to economic growth from the household sector in Q3. Household consumption led economic growth in Q2 contributing 0.4ppt towards the overall 0.9% increase. 

Wednesday, October 31, 2018

Australia's trade surplus rises sharply in September

Australia's monthly trade surplus increased sharply in September to above $3 billion — its strongest result since February 2017. Earnings from exports increased close to expectations, while a decline in expenditure on imports helped to accelerate the headline result. 

Meanwhile, in separately released data prices for Australian goods exported increased more strongly than forecast in the September quarter.   

International Trade – September | By the numbers 

  • Australia's trade surplus in September was $A3.017bn, which far exceed the market forecast for a surplus of $1.7bn. August's surplus, previously reported at $A1.604bn, was revised sharply higher to $2.342bn. 
  • Export earnings increased by $283m, or 0.8%, to $37.496bn
  •  Import values declined by $392, a fall of 1.1%, to 34.479bn


  • Australian export goods prices increased by 3.7% in Q3 (exp 2.2%), to be 14% higher over the year
  • Import prices lifted by a softer 1.9% (exp 1.0%) in the quarter and 9.8% in annual terms


International Trade – September | The details 

On the exports side of the equation, total earnings lifted by $283m to $37.496bn, which was largely the result of a $678m rise from earnings derived from exports of non-rural goods. 

Specifically, metal ores and minerals (mainly iron-ore) surged by 7%, or $551m, to a touch above $8bn. The ABS reported that this was mainly attributable to higher prices, with lump rising by 5% and fines by 4%. Also contributing was a 6%, or $270m, increase in earnings from other mineral fuels, which totaled $4.942bn. This was driven by higher prices for LNG exports. Meanwhile, rural goods earnings were little changed rising by $33m to $4.211bn. 

Moderating these increases, earnings from coal exports eased by 3%, or $141m, to $5.406bn following broad-based declines in prices and volumes. The main weight to export earnings was non-monetary gold – a typically volatile component  which declined by $525m, or by 26%, to $1.498bn.

Services exports posted a 1% rise to $8.156bn, accounting for around 22% of total export earnings. Tourism saw a 2% increase in the month to $5.627bn.  

On the imports side, the total value of goods and services imported fell by $392m in September to $34.479bn. This mainly reflected a $607m drop in the value of capital goods imported, where the weakness was broad based across the categories including civil aircraft (-$299m) and machinery and equipment (-$107m). Non-monetary gold also declined by $59m to $359m.

The services imports bill was little changed in September, rising by $11m to $8.165bn. Overseas tourism declined by 1%, or $25m, to $4.754bn. 'Other services', including business services, were flat at $2.931bn. 

International Trade – September | Insights 

With all data for Q3 now to hand, the ABS reported that its preliminary estimate for the trade surplus in the quarter on a seasonally adjusted basis was $6.404bn, which is some 52% higher than the surplus recorded in Q2. However, that escalation in the trade surplus over the quarter appears to be reflective of stronger commodity prices, which offset declines in volumes exported. Net-exports, which reflect volumes only, may therefore only contribute marginally to economic growth in Q3. The trade prices data would support this view, which implied a Terms of Trade boost of 1.1%, driven by price increases in LNG, iron-ore, and coal. 

Tuesday, October 30, 2018

Australian inflation softens in Q3

Australian inflation eased in the September quarter, due largely to the impact of a federal government change to childcare subsidies that was introduced at the start of the quarter. More pertinent from a policy perspective, core inflation also eased for the second consecutive quarter and has now been below the Reserve Bank of Australia's target since the December quarter of 2015. 

Consumer Price Index — Q3 | By the numbers 

  • Headline inflation was 0.4% in Q3, while the annual pace slowed to 1.9% — market expectations were for 0.5%q/q and 1.9%Y/Y (prior in Q2: 0.4%q/q and 2.1%Y/Y)
  • Core inflation was softer than expected in Q3 at 0.32% (exp 0.4%), which saw the annual pace essentially unchanged at 1.75% (exp 1.9%). In Q2, core inflation was revised to 0.42%q/q and 1.77%Y/Y from the initial estimates of 0.46%q/q and 1.87%Y/Y. 
click to expand 


Consumer Price Index — Q3 | The details 

Looking across the details of the groups that make up the CPI basket, the standout factor was from 'furnishings, household equipment, and services', which overall subtracted 0.12ppt from inflation in Q3. Childcare comes under this category as a component of household services. By itself, childcare subtracted 0.19ppt from inflation in the quarter as a result of the changes to federal government subsidies, which help to offset the cost of those services. Other subtractions were minor; health -0.02ppt from lower pharmaceutical and medical services costs   and communications -0.04ppt due to cheaper equipment and services costs. 


Most groups added modestly to inflation in the quarter. The important housing group added 0.11ppt, driven mostly by higher rates and utility costs (both +0.04ppt), while rents added just 0.1ppt and new housing was flat. 

Food and non-alcoholic beverages saw its strongest contribution to quarterly inflation this year at 0.09ppt, with fruit and vegetables adding 0.05ppt to that figure. The ABS reported that these increases were a reflection on supply issues stemming from adverse-weather conditions early in 2018. Meanwhile, the contributions from alcohol and tobacco were 0.05ppt and 0.06ppt, respectively.

Sources of inflation from discretionary areas of retail remain subdued, with clothing and footwear adding just 0.01ppt in Q3.  Meanwhile, the transport group added 0.09 to inflation, with fuel accounting for 0.06ppt of that increase.

The strongest contribution to inflation came from 'recreation and culture' at 0.23ppt, which reflected a strong 0.15ppt rise in the cost of international holiday travel, while domestic holiday travel added 0.08ppt.   

The chart, below, provides the price changes across the categories in percentage terms for Q3 and over the past year. 


Inflation from non-tradables  — largely reflecting domestic factors — despite easing from an annual pace of around 3% to 2.2% following the changes to childcare subsidies, continues to drive the inflationary pulse in Australia. Inflation from tradables — goods and services where prices are influenced by global market forces — has been lifting but remains subdued at around 1.4% in annual terms.   


Consumer Price Index — Q3 | Insights

A soft inflationary outcome was expected in Q3, and this was signaled by Reserve Bank of Australia in their previous Statement on Monetary Policy, which highlighted the changes to the childcare subsidies as well as some other once-off impacts in the quarter around education costs and car registrations. The softening in core inflation, though, reverses momentum that appeared to be building towards the lower 2% target. 

Highlighting the soft inflationary environment, market goods and services ex-volatile items — reflecting market-based inflationary pressures and removing once-off impacts from government policy changes  remains stuck at around 1.1%Y/Y. Administered prices — areas impacted by government policy such as alcohol, tobacco, utilities, childcare, private health insurance etc — continue to be the predominant sources of inflation in Australia.


Monday, October 29, 2018

Australian building approvals continue to soften

Australian dwelling approvals posted a modest increase in September, albeit having slowed sharply over the past and likely has further to run before consolidating. 

Building Approvals — September | By the numbers

  • Total dwelling approvals (private sector, seasonally adjusted) increased by 2.3% in the month to 16,777 (vs mkt forecast for +3.8%). The annual pace of approvals decelerated further to -14.6% from -12.5%.   
  • Approvals for houses declined by 2.7%m/m to 9,266 to be down by 7.5% on the year
  • Unit approvals lifted by 9.2%m/m to 7,512, which equates to a 21.9% fall over the year
click charts to expand

Building Approvals — September | The details 

Taking into account both the private and public sectors, total dwelling approvals were 51,630 for the 3-months to September. This is the lowest quarterly total since Q2 2014. The running 12-month total was 225,479, easing back to the level seen towards the end of 2017.


What is becoming increasingly clear is that with approvals now past their recent peak, there is a broad-based slowdown across all categories of dwellings. The granular data shows that while the slowing has been sharpest in the high-rise category (buildings with 4 or more storeys), house approvals — which are typically the most stable of all dwelling types — are also easing, as are approvals for townhouses and units in low-rise buildings (of between 1-3 storeys). 


Looking at approvals on a state-by-state basis, strength in Victoria drove the national headline result, overcoming weakness evident in most other states. Victorian approvals increased by 30.5% in September — entirely reflective of a spike in unit approvals in Melbourne. Elsewhere, seasonally-adjusted approvals declined in the month for; New South Wales -6.8%, Queensland -10.5% and Western Australia -19%. South Australia, however, saw approvals rise by 7.8%.

Building Approvals — September | Insights

The slowdown in approvals likely reflects a range of factors including tighter financing conditions, softening in property prices and concerns of oversupply in certain markets around the nation. Slowing approvals volumes point to reduced residential construction activity, although it is also true that the amount of work currently underway is at elevated levels. It is likely that residential construction will provide only a modest addition to economic activity in the quarters ahead, before possibly becoming a drag on economic activity into next year.   

Friday, October 26, 2018

Weekly note (26/10) | Risk aversion leads to volatility

Global markets saw heavy declines this week as volatility increased again, while the global economic calendar was light on top-tier releases. Risk-averse sentiment appears to have gained increased momentum across the markets during recent weeks, as the widely-cited risks from rising US interest rates, trade tensions, political uncertainty and a softer outlook for global growth now come into focus, having been largely consigned to the background for much of the year. The precise catalyst that has driven this change in focus is difficult to pinpoint, but the result has seen global bond yields drifting higher, equity markets knocked down heavily, and historically regarded safe-haven currencies supported.  

This has set a difficult environment for the ongoing corporate reporting season in the US. At a headline level, the balance of results continues to be strong from an earnings perspective
, although it is the outlook that markets are now less optimistic about, with concerns that earnings are now at peak levels in the cycle. When taken in the context of rising bond yields, this has led to scrutiny over valuations placing pressure on equity markets. From their 2018 peaks, US markets have declined by around 8 to 12%, Europe by around 12 to 17%, and Asia from around 11% to well in excess of 20% on the downside.  

While it should be highlighted that the scale of these declines has occurred in the context of some much stronger increases over the past couple of years, the more pressing factor for markets is understanding where the circuit breaker to the volatility may come from. Most of the discussion here has been around if or when the US Federal Reserve may respond to the potential risks posed to the real economy from tighter financial conditions following interest rate rises, reduced liquidity with stimulus measures being tightened and from the volatility in markets. 


— — —

In Australia, most of the focus this week was around the housing market with the local data calendar light on events. In particular, the price declines recorded in Sydney and Melbourne over the past year or so continue to be highlighted, while slowing auction clearance rates, which according to CoreLogic data have fallen below 50% on a national basis to their lowest in around 6 years, have also gained increased attention. 


However, the key point for us is understanding what impact the slowing housing market could have on the outlook for household consumption spending — the largest component of the domestic economy. This week's chart of the week, which comes courtesy of Dr Alex Joiner, Chief Economist at IFM Investors, is instructive to this point (you can follow Dr Joiner on social media here).  


The chart highlights that with softening property prices and, more recently, the declines on global equity markets, household wealth is likely to be easing further through the second half of 2018. Meanwhile, following slow growth in income over recent years, household saving has been declining and now sits at a decade-low level at 1%. That combination of factors — declining wealth and low saving — together with a likely persistence in slow wages growth could be the catalyst that sees households adjust by restricting consumption spending over the quarters ahead.   

Chart of the week 

Turning to the US, the main event was Friday's first estimate of economic growth for the September quarter. The US economy expanded at an annualised pace of 3.5% in Q3, which while slower than Q2's outcome of 4.2% was ahead of the market forecast for growth of 3.3%. The composition of growth was led by personal consumption spending on goods and services and public demand, although subtractions to growth from business investment and residential construction are likely to raise concerns that the tailwind from tax cuts may be fading, as higher interest rates continue to work through to the real economy and ongoing uncertainty over trade with other countries remains. 

In Europe, there were two main factors this week. Firstly, the European Central Bank (ECB) held their policy stance unchanged, as expected, at their latest meeting. The ECB maintained the guidance it provided from June this year, with its quantitative easing purchases now tapered to €15 billion per month from the previous level of  €30 billion per month. 

While ECB President, Mario Draghi, noted that the momentum in recent economic data had weakened, the risks to the growth outlook were "broadly balanced". To that end, the ECB had not discussed at this meeting extending its asset purchases beyond the scheduled conclusion at the end of 2018. Meanwhile, signs of stronger wages growth were noted, with the ECB confident in inflation lifting towards its target, predicated on an "ample degree of monetary accommodation" remaining in place.    

Secondly, earlier in the week the European Commission rejected the Italian government's draft budget for 2019, which proposed to increase deficit spending by 0.8ppt to 2.4% of GDP. EU rules require Italy to now outline a budgetary proposal to reduce its deficit by 0.6ppt to 1% of GDP, with 3 weeks to respond. Also, rating agency Moody's reduced Italy's bond rating to Baa3 — its lowest investment-grade rating — however, it maintained the country's outlook at 'stable', which allayed fears of a downgrade to 'negative'. 

Friday, October 19, 2018

Weekly note (19/10) | Risks remain in focus for markets

It was a generally calmer week for global markets, which were looking rebase following last week's spike in volatility that precipitated heavy declines in equity markets. While measures of financial market volatility eased, investor sentiment remained constrained by the ongoing risk factors from increasing US interest rates, trade concerns and political and economic tensions in Europe.   

In the US, the focus was on the early stages of the corporate reporting season. Last week's scrutiny over corporate valuations makes this a particularly important period as markets look for confirmation that earnings growth can sustain elevated valuations. Overall, the headline detail appeared generally positive, highlighted by Netflix posting above-consensus earnings following strong subscription growth. The news was also positive in the financial sector, with better-than-expected results from the major banks; JP Morgan Chase, Morgan Stanley, Goldman Sachs', Wells Fargo and Citi, although Bank of America Merril Lynch disappointed on loan growth. Outside of financials, the main disappointments were from IBM and Walmart.


For Australia, the strong results posted by US banks had helped to put a floor under the heavy declines in the financial sector from last week, although the recovery was modest in that context. Across the week, the benchmark ASX200 index posted a solid rise, which was supported
 by the consumer sectors. 

More broadly, the major indices in Europe mostly saw modest weekly gains after declining sharply by more than 4% last week. In Asia, against the trend of less volatile global markets, China's major indices fell heavily again this week — despite a rebound on Friday  weighed by broader concerns over the growth outlook and financial stability. 


— — —

In Australia, the focus this week was on the labour market. Firstly, the Reserve Bank of Australia's (RBA) Deputy Governor Guy Debelle delivered a speech titled 'The State of the Labour Market', where the commentary continued to reflect the RBA's upbeat assessment of conditions. 

In summary, the RBA expects employment growth to remain above average and run ahead of growth in the working-age population. Combined with its forecasts for above trend economic growth, it continues to expect a gradual erosion in 'spare capacity' (unemployed and underemployed workers) and, in turn, a gradual rise in wages growth, which would ultimately lift inflationary pressures. 

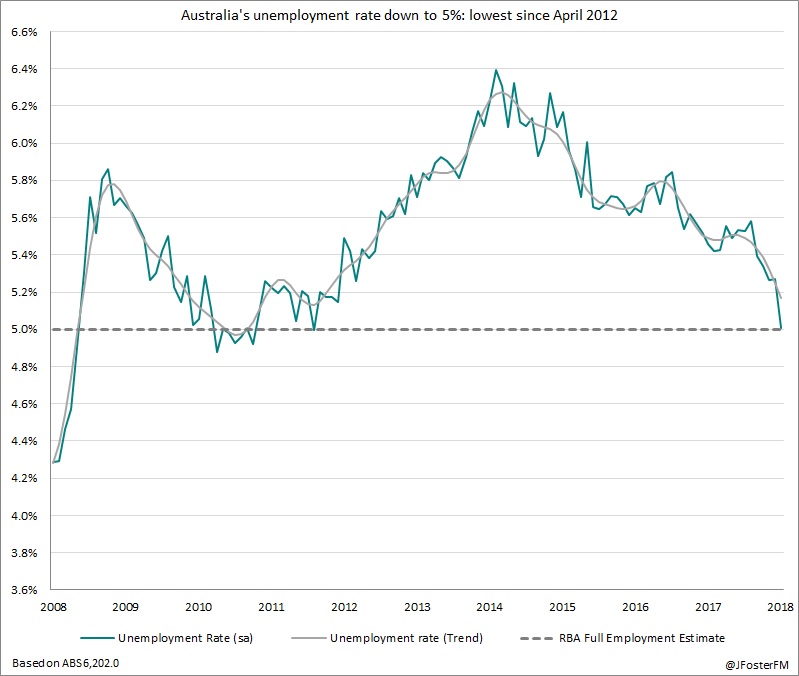
Secondly, Australia's latest employment data for the month of September were released during the week. While only 5,600 jobs were added in the month, below an expected addition of 15,000, the nation's unemployment rate fell to 5% on a seasonally adjusted basis — its lowest level in more than six years and therefore is our chart of the week.  

Chart of the Week


Historically, the RBA has estimated Australia's rate of full employment to be around 5%. In technical terms, this is referred to as the non-accelerating inflation rate of unemployment (NAIRU), which is the level of unemployment where wage and inflationary pressures generally remain stable. 

However, as outlined in our review of September's Labour Force Survey, the sharp fall in the unemployment rate is not likely to portend a faster rise in wages growth in the near term. Furthermore, recent global experiences would suggest that unemployment rates have had to decline well below previously estimated NAIRU's to stimulate wage pressures, so this could also be the case for Australia.  


The main event during the week from a global-macro perspective were the minutes from the US Federal Reserve's meeting in September, where it increased its benchmark interest rate by 25 basis points to a target of 2-2.25%. 

The key point from these minutes was that the Fed sees the need for further interest rate increases given strong economic growth and a tight labour market. Of note, Fed members had discussed the possibility of rates being increased temporarily to a 'modestly restrictive' level to reduce the risk of inflation running above its 2% target and to prevent imbalances to financial stability from building up. While support for this stance was not unanimous without clearer signs of an overrun in inflation, it appears that the Fed is set to maintain its path for tightening, which as implied by its 'dot plot' points to one further increase in December, followed by three increases in 2019.

In Europe, last week's optimism that a Brexit deal may be imminent seemed to fray given renewed uncertainty over negotiations regarding the Ireland-Northern Ireland border issue. UK Prime Minister Theresa May also said she would consider the possibility of extending the 'transition period' for "a matter of months" after Britain exits the European Union (EU) in March next year, but that would still need to be supported by the parliament. 

The greater risk to markets from Europe are the tensions between the EU and Italy over its budget. Italy released its budgetary plans for 2019, which would increase its deficit to 2.4% of GDP  a level 3-times above the 0.8% target mandated by the EU and agreed to by the previous government. European Central Bank President Mario Draghi warned that contravention of the target would "carry a high price" for the other eurozone economies.

Rounding out the global risk factors, China's GDP growth for the September quarter slowed to an annual pace of 6.5%, which was a touch softer than expected by markets (6.6%). Policymakers in China face a delicate balance between implementing stimulus measures to ward off moderating economic growth, with the impact of trade tensions yet to be fully reflected in the data, while at the same time managing risks to financial stability from earlier concerns over the quality of lending, particularly from the non-bank sector.   
  

Wednesday, October 17, 2018

Australia's unemployment rate falls to 5%: lowest in 6 years

Australia's Labour Force Survey for September showed the nation's headline unemployment rate fell to 5%, its lowest level since April 2012. Australia's level of full-employment has generally been regarded to be around 5%, although it is likely that the unemployment rate will need to decline further, and then remain there for wages growth to lift more strongly than it has, which would then flow-on to lifting inflationary pressures.

Labour Force Survey — September | By the numbers
  • Employment increased by 5,600 in September, which was below the median market forecast for +15,000. August's initially reported gain of 44,000 was lifted a touch to 44,600
  • The seasonally adjusted unemployment rate fell to 5.00% (market f/c was 5.3%) from the level in August at 5.27%
  • Participation rate fell 0.24ppt to 65.44% (market f/c was for no change at 65.7%)
  •  Total hours worked in September lifted 0.4% to 1.757bn hours (+1.9%Y/Y)
  •  Underutilisation rate fell 0.2ppt to 13.3%, while the underemployment rate was steady at 8.3%  

*click to expand charts


Labour Force Survey — September | The details

On a compositional basis, the 5,600 addition to employment in September was split +20,300 to full-time and -14,700 to part-time. Employment growth remains solid at an annual pace of 2.27%, but it has been easing through 2018.


Consistent with the rise in employment and the decline in the unemployment rate, total hours worked lifted in September (+0.4%), with an annual increase of 1.9% to 1.757bn hours. Adjusting those figures for the change in participation, average hours worked per person lifted 0.3% in the month to 139.1 hours, although this is 0.4% below the level from a year ago (139.6 hours). 


For the first time, the Australian Bureau of Statistics (ABS) published monthly estimates of underemployment (those employed but looking to work more hours) and underutilisation (combining the underemployed and unemployed). These figures were previously only available on a quarterly basis. In September, the ABS reported that the underutilisation rate fell 0.2ppt to 13.3%, while the underemployment rate remained at 8.5%. 


The state-level unemployment rates were improved in September, with declines for; New South Wales (-0.25ppt to 4.39%), Victoria (-0.19ppt to 4.55%), Queensland (-0.34ppt to 5.98%), South Australia (-0.2ppt to 5.5%) and Western Australia (-0.37ppt to 6.03%). Tasmania was little changed (-0.02ppt to 5.77%).     

However, outcomes were more varied in terms of employment creation in the month; New South Wales +2,800, Victoria +20,000, Queensland -11,600, South Australia -200, Western Australia +3,100 and Tasmania -1,400. 

For Q3, Australia-wide employment lifted by 45,600, with this outcome dominated by Victoria +48,500 and New South Wales +19,500. A similar concentration is evident over the past 12-months, with national employment growth of +280,900, led by New South Wales +134,200 and Victoria +85,500. Clearly, a more balanced spread of employment growth would be desirable going forward.  


Labour Force Survey — September | Insights   

The overall tone of September's data was positive although, given that the decline in the headline unemployment rate occurred alongside a fall in participation, it remains to be seen whether that 5% rate can hold or be improved upon. Note that the ABS highlighted that 'sample rotation' played its part the incoming group had lower unemployment and participation rates than the sample.

Given the month-to-month volatility, the Reserve Bank of Australia (RBA) will likely be focusing on the trend unemployment rate, which remains at 5.2% after revision. The RBA, on current forecasts, does not anticipate the unemployment rate declining sustainably to 5% until the end of 2020. Meanwhile, despite some improvement, labour force underutilisation remains elevated, which is reason to think that stronger wages growth is still some way off, particularly given the uneven nature of state employment growth.