Independent Australian and global macro analysis

Thursday, December 7, 2023

Australia's trade surplus rises to $7.1bn in October

Australia's goods trade surplus widened to $7.1bn in October from a downwardly revised $6.2bn in September. This was below the 3-month average ($7.7bn), which has retraced to lows since early 2021. Exports lifted modestly (0.4%m/m) but are down nearly 18% on their mid 2022 peak as commodity prices have unwound. Import spending remains around record highs despite declining by 1.9% in the month. 


After narrowing to a 2½-year low in September ($6.2bn), the goods trade surplus widened to $7.1bn in October. This is half the level it was a year ago ($14.2bn), with export income falling 11.9% over the period and imports rising 2.4%. On a 3-month average basis, the surplus was $7.7bn, back in line with early 2021 levels. 


In October, exports consolidated (0.4%) coming in at $45.5bn, which followed a 1.8% fall in the prior month. Rises in non-rural goods (0.4%) and the volatile non-monetary gold (5.3%) overcame a decline in rural goods (-1.8%). The non-rural goods category was boosted by a lift from iron ore (2.3%) to $16.3bn, the level up by 17.3% over the year in contrast to the large falls seen in coal (-37.4%) and LNG exports (-41.5%).


Spending on imports fell 1.9% in October to $38.4bn. This was after imports posted their sharpest rise in 19 months in September (8%). An 11.2% fall in capital goods was the main driver, a continuation of the pattern of volatile movements seen in recent months. 


Consumption goods were soft (-0.5%) on the back of falls in household goods and electrical items. These declines were partially offset by 1.4% rise in intermediate goods as the value of fuel imports saw a 10.3% rise, rebounding to $6.2bn to be up 39.5% on their recent low in July. 

Wednesday, December 6, 2023

In review: Australian Q3 GDP: Slowdown continues; Consumption stalls

The slowdown in the Australian economy continued in the September quarter. Real GDP was 0.2% quarter-on-quarter - the weakest outturn in a year - coming in below expectations (0.5%) after growth expanded by 1% through the first half of the year. Pressures on household finances are weighing heavily on consumption, driving the slowdown. Growth firmed from 2% to 2.1% through the year, down sharply from a 5.8% pace 12 months ago. Rapid post-pandemic population increase (2.4%) continues to imply weakness in per capita GDP (-0.3%Y/Y).  


The Australian experience is consistent with the slowdown in advanced economies offshore, with growth across the OECD averaging 1.7% through the year to Q3. US growth has been a notable exception, accelerating in the most recent quarter (1.3%) to 3%Y/Y. In China, growth has been patchy from quarter to quarter as it has continued to come out of the pandemic.


Domestic household consumption has slowed sharply over the past year, stalling in the September quarter (0%). Elevated inflation has caused a historic decline in real disposable incomes. At the same time, disposable income has been squeezed by the RBA's tightening cycle, while the strong labour market and rising wages have led to a rising tax burden. Combined, mortgage interest costs and income tax are taking up a very high (and still rising) share of gross income.


Consumption growth, though weak, is still positive but would almost certainly be declining without households having the sizeable stock of savings accumulated during the pandemic to spend from. The extent and duration of the savings draw-down remains to be seen, a key variable to the economic outlook. However, if Australian inflation follows global trends and decelerates at pace in 2024, an improved dynamic around real incomes could support consumption by more than many expect.     


Driven by the slowdown in household consumption, private demand has continued to weaken (0.2%q/q, 1.4%Y/Y). This also reflects an easing of momentum in investment in the quarter after tax incentives for new equipment purchases expired. Meanwhile, residential construction activity remains weak. An expansion in public demand (1.4%q/q, 4.2%Y/Y) has bolstered the Australian economy, holding an even sharper slowdown at bay.


Overall, the September quarter National Accounts confirm that demand conditions in Australia have cooled materially. Indications are that this will continue, which should help to ease domestic inflation through 2024. The cash rate (4.35%) looks unlikely to rise any higher, despite the RBA leaving its tightening bias in place at its final meeting for the year.   


— — —

National Accounts — Q3 | Expenditure: GDP (E) 0.2%q/q, 2.1%Y/Y


Household consumption (0%q/q, 0.4%Y/Y) — Pressures on household budgets from the cost of living, rising interest rates and taxes have intensified, causing household consumption to slow to the point of stalling in Q3 (0%). Growth came close to flatlining through the year (0.4%) and is down substantially from its pace 12 months ago (11.8%).


In nominal terms, household incomes are rising sharply (1.8%q/q, 7.5%Y/Y), supported by the strongest labour market conditions in decades and recent increases to award rates. But this is being offset by elevated inflation, higher interest rates and rising taxes. Reflecting all this, disposable income growth is weak (0.1%q/q, 1%Y/Y) - deeply negative in real terms (-1.3%q/q, -4.6%Y/Y) - and the household saving ratio fell to its lowest level since 2007 at 1.1% in Q3.


Although the RBA held rates steady through Q3, interest costs continued to rise (7.6%) as more fixed-rate periods on mortgages rolled onto higher variable rates. Meanwhile, income taxes surged (7.6%q/q) due to rising wages pushing people into higher tax brackets and with the Low and Middle Income Tax Offset ending. 


Despite these headwinds, discretionary-related consumption (0.7%) saw its first quarterly rise in a year, as the essential category contracted (-0.5%). That profile suggests households were spending out of the stock of savings built up during the pandemic, estimated widely to be in the order of $250bn. The rebound in discretionary consumption included a 13% surge in new vehicle purchases, a 3.9% lift in transport services (associated with overseas travel) and a 0.9% increase in hospitality services, boosted by the FIFA Women's World Cup. The weakness in essentials appears overstated given that it reflects the effect of government rebates reducing household spending on utilities and child care. 


Dwelling investment (0.2%q/q, -0.3%Y/Y) — Residential construction activity remains weak rising by just 0.2%q/q, with higher interest rates and capacity pressures weighing over the past year (-0.3%). New home building saw a modest fall (-0.3%), declining for the first time in 5 quarters. Alteration work has been unwinding from the surge this activity saw during the pandemic; however, it posted its first increase in 2 years with a 1% rise coming through in Q3. 


Business investment (0.6%q/q, 8%Y/Y) — Business investment has been resilient to the broader economic slowdown. Growth was particularly strong through the first half of 2023 (6.8%) but the momentum slowed in Q3 (0.6%). This came after machinery and equipment investment was frontloaded into the first half (9.1%) ahead of the expiry of pandemic-related tax incentives at the end of the 2022/23 financial year. This subsequently saw equipment investment consolidating in Q3 (0.2%). Non-dwelling construction - also strong in the first half (5.4%) - eased (0.6%) as building activity fell (-1.5%); however, a surge in mining sector investment (9.6%) supported engineering work (2.3%).  


Public demand (1.4%q/q, 4.2%Y/Y) — A major driver of growth in Q3, contributing 0.3ppt to real GDP. Strength in public demand over the past year (4.2%) has bolstered the economy from the slowdown in private demand (1.4%) as the pandemic recovery has cycled and cost-of-living pressures and higher rates have taken effect. Governments have attempted to moderate these headwinds through measures such as rebates on energy bills, child care payments and assistance for pharmaceuticals and aged care, underpinning a lift in public expenditure to 1.1%q/q (2.9%Y/Y). Meanwhile, progress in rolling out the large pipeline of public transport, energy and communication projects continued at pace in Q3 (2.8%q/q, 11.6%Y/Y).  


Inventories (0.4ppt in Q3, -1.1ppts yr) — A large rise in mining sector inventories - the outcome of exports falling by more than the decline in production - underpinned the headline 0.4ppt contribution to real GDP in Q3. Wholesaler inventories increased as the easing of global supply pressures facilitated the delivery of new vehicles. 


Net exports (-0.6ppt in Q3, 1.4ppts yr) — Subtracted 0.6ppt from quarterly activity, largely reversing its 0.8ppt contribution to growth in the previous quarter. Export volumes declined by 0.7%, backsliding to be 3.2% below pre-Covid levels at the end of 2019. Weakness in resources exports (-4.7%) were the main driver. There was some offset from the services sector (1.9%), supported by inbound travel for the FIFA Women's World Cup and by overseas students. Imports advanced by 2.1%, rising to be nearly 10% above pre-Covid levels. Services imports surged in Q3 (8.4%) on the back of strong demand for overseas travel. 


— — —

National Accounts — Q3 | Incomes: GDP (I) 0.2%q/q, 2.0%Y/Y 


Australian national income was weighed by another decline in the terms of trade (-2.6%), its fourth decline from the past five quarters to be 14.1% below its record high in mid-2022. Export prices contracted by 1.4%, reflecting falls in major commodity prices amid slower global growth and elevated inventories, while import prices lifted by 1.2%.  


Although the terms of trade fell, nominal GDP growth was 1.2% in the quarter (4.5%Y/Y), rebounding from a fall in Q2 (-0.7%). This outcome came on the back of a 1% rise in economy-wide prices together with the 0.2% lift in output.


Wage incomes rose at an accelerated pace in Q3 (2.6%), its fastest rise in a year, to be up by 8.4% through the year. This quarterly rise was supported by the continued strength in the labour market, the Fair Work Commission's increases to award rates and the lifting of public sector wage caps. 


Due to hours worked in the economy contracting in Q3 (-0.6%), non-farm wages rose by an even sharper 3.1%q/q to 4.1% in year-ended terms. However, an increase in quarterly productivity of 0.8%q/q (as output rose and hours worked declined) meant that some of that uplift in wages was offset. Unit labour costs for firms - labour costs adjusted for productivity - lifted by 2.2% in Q3, with the year-ended pace easing from 6.9% to 6.4%. 


After falling by 7.6% in the previous quarter, company profits in the non-financial sector declined by a further 4.5% in Q3 to be down by 6% through the year. Weakness in commodity prices weighed on mining profits, while margin pressures crimped profits in professional services and in transport services. By contrast, financial company profits are advancing (2.1%q/q, 6.4%Y/Y) with net interest margins expanding due to higher interest rates. Small business and farming profits (gross mixed income) were broadly flat in Q3 (0.3%) but down 4% year-on-year.  


— — —

National Accounts — Q3 | Production: GDP (P) 0.2%q/q, 2.1%Y/Y

The September quarter GDP production estimate was 0.2%, matching the headline growth outcome. Year-ended growth firmed modestly from 1.8% to 1.9%. Gross Value Added (GVA) in the services sectors advanced, led by household services (1.2%) from business services (0.4%). The goods sectors were broadly offsetting: goods production contracting (-0.5%) but goods distribution expanding (0.5%). 


Household services saw broad-based gains in output across the various industries. The FIFA Women's World Cup supported the hospitality (1.5%) and arts and recreation (2%) industries. Public health services underpinned the health care industry (1.8%). Business services moderated from Q2 (0.9%), driven by a pullback in labour hire and recruitment that weighed on administration and support (-1.7%). Media services drove the telecommunications industry (2.6%). Professional services picked up on the back of increased demand for engineering services. 


Goods distribution (0.5%) was driven by a pick-up in demand in the retail industry (0.6%) for household goods and clothing and as supply chain pressures for new vehicles eased. The transport industry remained robust supported by overseas travel demand. Goods production contracted (-0.5%), with utilities falling (-2.6%) as unseasonably warm weather reduced household demand for energy. Mining production also declined (-1%) amid outages for maintenance. 

Tuesday, December 5, 2023

Australian GDP slows to 0.2% in Q3

Growth in the Australian economy slowed to 0.2% in the September quarter, below expectations (0.5%) and the weakest quarterly growth rate in a year. There was little change in year-ended growth at 2.1% from 2.0% previously, but that has been underpinned by post-pandemic population growth (2.4%), implying a continuation of declining growth on a per capita basis (-0.3%Y/Y). Demand conditions have cooled materially as headwinds have impacted household spending. A continuation of this trend - which looks likely - should help ease inflationary pressures. The RBA Board has not ruled out further tightening, but that looks even less likely now than it did after yesterday's meeting. 


Notably, household consumption growth dried up in Q3 (0%) and is little more than flat (0.4%) through the year. Residential construction activity (0.2%) remains weak, though business investment - while moderating to 0.6% in the quarter - continues to be broadly resilient. These dynamics combined to see private sector demand ease from 0.6% in Q2 to just 0.2% in Q3, up 1.4% through the year. By contrast, public demand achieved that pace of growth in Q3 alone (1.4%), with both spending and investment advancing further. Inventories were a key growth support (0.4ppt), but net trade took 0.6ppt off quarterly growth, driven by weakness in exports (-0.7%). 


The main story in the National Accounts is around households. The headwinds that are impacting household finances from cost-of-living pressures and rising interest rates are intensifying. While households benefitted from a rise in wages growth as award increases came through, that was offset by increasing interest costs on mortgages (7.6%) - despite the RBA pausing through Q3 - and a higher tax burden (7.6%) due to the Low and Middle Income Tax Offset ending. Accounting for those factors, disposable income - what households are left with - was virtually flat in Q3 (0.1%) and up 1% through the year. Adjusting for inflation, real disposable incomes continued to decline (-1.3%q/q, -4.6%Y/Y). 


That backdrop has driven the slowdown in real household consumption, stalling in Q3. Weakness was concentrated in goods consumption (-1.3%) - despite vehicle purchases surging (13%) - with services advancing (0.8%), supported by overseas travel and hospitality services during the FIFA Women's World Cup. This led to the unusual situation of discretionary consumption (0.8%) accelerating despite the headwinds.


But that looks unlikely to be repeated into year-end: the household saving ratio has fallen to just 1.1% - its lowest since 2007. Households will need to draw down on their accumulated savings, which are substantial, to support consumption. 


More to come. 


RBA closes 2023 on hold

There was no follow-up increase to the cash rate (4.35%) from the RBA today after it elected to resume its tightening cycle last month. The Board will now assess developments over its summer break and has kept its options open to hike again if needed. But with significant easing cycles being priced into rates markets offshore in 2024, the window for the RBA to press on looks to be narrowing. 


In today's statement, Governor Michele Bullock revisited the November decision explaining that the call to hike by 25bps and end its 4-month pause came as the Board assessed "the risk of inflation remaining higher for longer had risen". That refers to the upward revisions the RBA made to its inflation outlook last month, with both headline and core CPI falling more slowly to reach 3% - the top of the 2-3% target band - by the end of 2025 (up from 2.75% previously). But the governor said there was no need to hike today given that the incoming data since the last meeting had been "limited" and the updates it had received on the labour market and inflation had been in line with its expectations. While the Board has gone back into pause mode, the governor noted that higher rates were working to cool demand and that the full effects of the tightening cycle on the economy remained in the pipeline.

The Board has retained its guidance that "Whether further tightening of monetary policy is required..." will be determined by the incoming data. Pausing today leaves the RBA to watch the data over the summer months, which will shape how it responds upon its return in February. The RBA is maintaining the optionality to hike further, but the cash rate may well be at its peak already. Inflation offshore looks to be slowing at an accelerated pace, prompting markets to price aggressive rate cutting cycles in the US and Europe next year. Governor Bullock took a cautious view saying that trends in goods prices offshore had been "encouraging" but services inflation "remained persistent". Only time will tell which narrative prevails. 

Monday, December 4, 2023

Australia Current Account -$0.2bn in Q3; net exports -0.6ppt

This morning's Australian international trade data have come in materially weaker than expected. The nation's current account returned to a broadly balanced position (-$0.2bn) in the September quarter, with large surpluses having been commonplace over recent years, while net exports look to have weighed more heavily on economic growth in Q3 (-0.6ppt) than markets had anticipated (-0.2ppt). 


Australia's current account narrowed from a surplus of $7.8bn in the June quarter (1.2% of GDP) to -$0.2bn in the September quarter (vs $3.3bn exp). This movement (-$7.9bn) was primarily driven by the trade surplus declining from $30.8bn to $22.9bn, with export income falling 2.1% ($163.3bn) and import spending rising 3.3% ($140.5bn); the income deficit was little changed at -$22.3bn (from -$22.7bn). 

Total income from exports contracted by 2.1% in Q3, reflecting falls in both underlying volume demand (-0.7%) and prices (-1.5%). The fall in volumes was driven solely by non-rural goods (-4.0%) as shipments of resource commodities contracted 4.7% in aggregate (iron ore -3.4%, coal -6.8% and LNG -6.3%). Although iron ore prices advanced (6.9%) there were sizeable falls in the prices received for coal (-9.1%) and LNG (-7.6%) exports. Services export volumes advanced by 1.9% in the quarter - slower than the gains of prior quarters - likely supported by travel associated with the FIFA Women's World Cup.


On the import side, expenditure rose at a 3.3% quarterly pace, with volumes lifting 2.1% and prices rising 1.2%. Volume demand for goods was relatively flat (0.5%) but services surged (8.4%), driven by overseas travel through the back end of the Australian winter. The rise in goods volumes came on the back of capital goods (3.4%) as industrial transport equipment (16.6%) spiked. 


Overall, the key takeaways from Q3 are: i) import volumes rose (2.1%) and exports fell (-0.7%), a dynamic estimated by the ABS to deduct 0.6ppt from Q3 GDP, and ii) import prices increased (1.2%) as export prices declined (-1.5%), resulting in the terms of trade falling 2.6% in the quarter, representing a hit to national income. 


Preview: RBA December meeting

The RBA is expected to leave the cash rate (4.35%) unchanged at today's meeting. This is to be the final policy meeting for 2023 and the last time the Board will meet at a monthly frequency - the RBA's practice for the past 3 decades - as it downshifts to an arrangement of 8 meetings per year from 2024 onwards, a key recommendation adopted out the recent review into the central bank.


Economic resilience and upside risks to the inflation outlook prompted the Board to resume its tightening cycle with a 25bps hike in November, ending a 4-month pause. Since then, the RBA's messaging has been widely interpreted as hawkish, though markets have detected a reluctance to hike again at this stage. That partly reflects a tweak in the Board's guidance from "Some further tightening of monetary policy may be required..." in October to "Whether further tightening of monetary policy is required..." coming out of the November meeting. 

Recent labour market data have remained solid, though the unemployment rate stands at 3.7% as of October, up from cycle lows (3.4%) 12 months earlier. Wages growth has accelerated with a lag, rising to 4% year-ended (a high since 2009) following the largest quarterly increase on record in Q3 (1.3%) on adjustments to awards, broadly in line with RBA forecasts. Markets effectively priced out any chance of a follow-up hike last week when the monthly CPI indicator surprised on the downside: headline CPI slowed from 5.6% to 4.9%yr in October, with the core rate (5.3%yr) and services inflation (5%yr) also easing.   

For a data-dependent Board, the fact that a couple of key data points are imminent, including the Q3 GDP outcome and the November labour market report adds to the case to hold. Pausing today will also afford the RBA time over its summer break to assess how the global disinflationary trends, which look to be accelerating in the US and Europe, are playing out and to consider the implications for Australia.    

The disinflationary process in Australia is lagging developments offshore and with the current forecasts only pointing to inflation being at the top of the 2-3% target band by late 2025, the RBA will clearly want to retain the optionality to hike further. Markets acknowledge this but price the chance of a February hike only at around 33%. The key to that decision will likely be the December quarter CPI report due in late January. 

Australian housing finance advances 5.4% in October

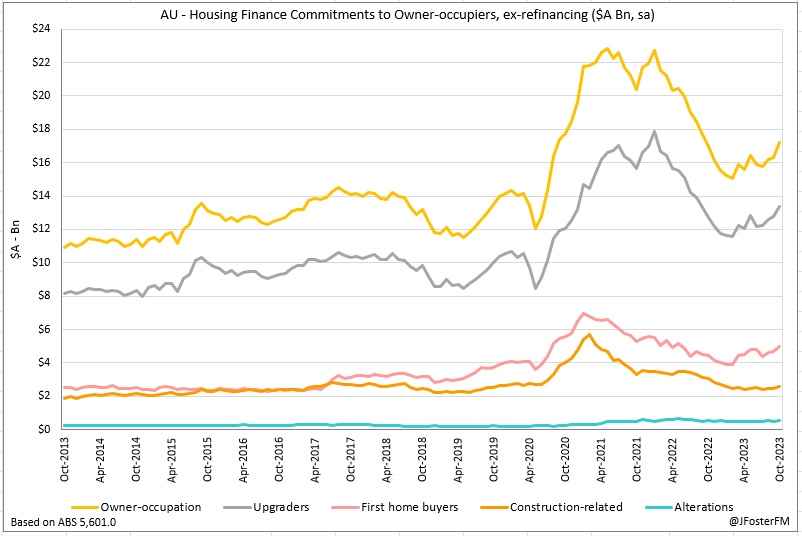
Australian housing finance commitments rose for the third month in succession lifting by a stronger-than-expected 5.4% (vs 1.1%) in October ($26.7bn). Commitments are now 17.5% above the cycle low in February ($22.8bn) as supply-demand imbalances have led to an upturn in housing prices, despite further RBA rate increases through the year. CoreLogic has clocked this upturn at around a 10% rise in the median capital city house price since January. 


October's 5.4% rise was the sharpest month-on-month lift in commitments since May. This gain came after the RBA held rates unchanged between July and October. It will be interesting to assess how the resumption of the tightening cycle in November may have impacted this momentum. 


Commitments to the owner-occupier segment posted a 5.6% lift - its sharpest rise going back to November 2021. At $17.2bn, commitments to the segment are up 14.2% on their trough in February ($15.1bn). Of note this month, construction-related lending accelerated 6.3% to $2.6bn, a high to the start of the year. Commitments to upgraders increased by 4.6% to $13.4bn, a 14-month high. There was also participation from first home buyers, with the value of commitments up 6.2% ($5bn) and loan volumes rising by 5.1% (9.8k).  


In the investor segment, new commitments lifted by 5% to touch a 16-month high at $9.5bn. These commitments have increased for 8 months on end to stand 23.9% above their cycle low ($7.7bn). Very low capital city vacancy rates, strong rent inflation and rising house prices have clearly been attractive fundamentals for many investors.  


Refinancing fell by 7% ($17.4bn), declining sharply for the third month running. Over this period, the value of refinancing has fallen by 19.5% (-21.6% in the owner-occupier segment and -15.2% for investors). Refinancing activity is clearly moderating after rising very sharply through the past couple of years as many borrowers rolled off fixed-rate periods onto higher variable rates. The RBA pausing rate hikes may have accelerated the decline.