Independent Australian and global macro analysis

Tuesday, June 4, 2024

Australian GDP 0.1% in Q1

Australian economic growth remained weak in early 2024 following a material slowdown last year. Real GDP growth was weaker than expected at 0.1% in the March quarter (vs 0.2% forecast), down from an upwardly revised 0.3% pace in the final quarter of 2023. Year-ended growth moderated from 1.6% to 1.1%, now tracking below the RBA's forecast trajectory. Excluding the Covid period, this was Australia's slowest annual growth rate since 1992 - but from a global perspective, this was a mid-table performance. 


Australian domestic demand slowed further expanding by just 0.2% quarter-on-quarter - its softest outturn excluding the pandemic lockdowns since early 2019 - though year-ended growth is still a respectable 2.3%. Within domestic demand, household consumption (0.4%q/q, 1.3%Y/Y) was the main driver of growth - a surprising outcome given cost-of-living pressures and higher interest rates. 


While still tepid, the March quarter outcome and earlier revisions paint a picture of household consumption being more resilient than previously estimated. An improving dynamic around real incomes (due to inflation slowing); a reduction in saving (household saving ratio decline from 1.6% to 0.9%); and some one-off factors appear to have boosted household consumption; notably, services spending accelerated by 1.1%q/q - its fastest rise since Q4 2022 - as overseas travel picked up and major events (Taylor Swift tour, Australian Open) were strongly attended. 


Across the other components in Q1, business investment (-0.7%) saw its first decline since Q3 2021, driven by weakness in non-residential construction (-4%). Dwelling investment remained weak (-0.5%) with alterations continuing to unwind while supply constraints and higher interest rates are weighing on new home building. Public demand (0.6%) lifted on medical services spending and government support measures for the cost of living. Meanwhile, a rebuilding of inventories added strongly to quarterly growth (+0.7ppt); however, that was offset by a large deduction from net exports (-0.9ppt). 

More to come. 


Australian Business Indicators Q1: inventories 1.3%

Data on Australian business inventories provided an upside surprise ahead of the GDP growth figures for the March quarter, due to print tomorrow. Private non-farm inventories look to have added 1ppt to quarterly GDP, helping to offset weakness in other components; however, a subdued growth outcome in the order of 0.2% is forecast.  


The Business Indicators series for the March quarter was generally reflective of a weak growth backdrop. Headwinds to the consumer from cost of living constraints and higher interest rates saw sales growth contracting (-0.7%) for the third time in the past 4 quarters. As a result, annual sales growth (-0.7%) fell to its weakest pace (outside of the pandemic period) since the financial crisis in 2008/09. 


The industry picture for sales growth showed broad-based weakness. The one exception was arts and recreation (3.7%), likely reflecting the boost from major events including the Taylor Swift Eras Tour, Pink concerts, and the Australian Open tennis. By contrast, other areas of discretionary demand - hospitality and retail - were weak.  


Despite the weakness in sales growth, firms rebuilt inventories during the quarter (1.3%). This comes after a drawdown in 2023 that subtracted around 1ppt from GDP growth. In Q1, inventories were up across retail (2.4%) and wholesale trade (1.4%) and manufacturing (0.5%), with mining also advancing (1.5%). This more than offset declines in hospitality (-4.9%) and utilities (-0.6%). Overall, Q1's rebuild is expected to see private non-fram inventories adding 1ppt to quarterly growth. 


Company profits took a 2.5% hit in the quarter coming in at $137.4bn (-8.6%Y/Y). This was driven by a 6.1% fall in mining profits on lower commodity prices, unable to be mitigated due to non-mining profits rising modestly (0.6%). Note that in tomorrow's National Accounts, company profits are likely to come in around flat on the quarter (0.1%), taking into account an adjustment for inventory valuations. 


The wages and salaries bill slowed further in Q1 (0.6%) as the year-ended pace moderated from 8% to 6.6%. The labour force data through the first quarter reported that employment reaccelerated, but hours worked were near flat. Also factoring into the slowdown is that the labour market has moved off peak levels of tightness from the second half of last year.     

Monday, June 3, 2024

Australia Current Account -$4.9bn in Q1; net exports -0.9ppt

Australia's current account swung back into deficit in the March quarter at -$4.9bn (-0.7% of GDP), a material downside surprise on expectations for a $5.5bn surplus. Backward revisions lowered earlier estimates of the current account surplus - materially so in the previous quarter ($2.7bn from $11.8bn) - and with the quarterly trade surplus narrowing by $6.6bn, the current account returned to deficit in Q1 - only the third deficit in the past 5 years. Net exports deducted a sizeable 0.9ppt from GDP growth in Q1. 


Since peaking at around 4% of GDP in 2021, the current account has retraced, falling into deficit in Q1 (-0.7% of GDP) for the second time in the past three quarters. Backward revisions to estimates of the current account in today's report were substantial and to the downside. 


A $6.1bn narrowing in the underlying trade surplus (from $23.9bn to $17.8bn) in Q1 drove the current account into deficit, with the income deficit widening modestly (-$20.8bn to -$22.3bn). The terms of trade stabilised in the quarter (0.2%) - export prices fell 1.7% and import prices were down 2% - so the narrowing in the trade surplus was predominantly driven by volume changes. 


Export income declined by 1.1% in Q1 to $165.5bn (-5.1%Y/Y), reflecting lower prices (-1.7%) and a modest lift in volumes (0.7%). Key drivers behind the increase in quarterly volumes were: other mineral fuels (LNG) (8.3%) and meat (8.5%). Services exports declined (-1.1%), implying the boost to local demand from spending by tourists and students waned. 


Turning to imports, spending increased by 3% in the quarter to $147.8bn, up 6.4% through the year. This was driven by a rebound in volumes (5.1%q/q) - the strongest rise in two years - following a decline in Q4 (-3.5%). Consumption goods (9.5%) rose broadly, while intermediate goods (6.8%) and capital goods (2.7%) also supported the uplift in volumes. The 2% fall in prices was an encouraging sign that more of the global disinflationary impulses from overseas (particularly in goods) will flow through to Australia in the quarters ahead.  


Overall, with import volumes (5.1%) lifting much more sharply than exports (0.7%), the ABS reported that net exports will deduct a sizeable 0.9ppt from GDP growth in the March quarter, a slightly larger drag than forecast by markets (-0.7ppt). 

Friday, May 31, 2024

Macro (Re)view (31/5) | Inflation data remains influential

The latest data on prices in the US helped spark a modest relief rally at the front end of the yield curve; however, soft Treasury auctions were influential in driving the curve steeper over the week - a headwind to equities. In Australia, stronger-than-expected inflation data reinvigorated pricing for an extended RBA hold, lifting domestic bond yields and supporting the AUD. 


Key US inflation data was in line with expectations in April, avoiding an upside surprise but still leaving the Fed well adrift from its 2% target. The core PCE deflator lifted 0.2% month-on-month (the slowest increase since December) as the annual pace printed at an unchanged 2.8%. This was an improved reading compared to recent months that reflected inflationary pressures regaining momentum in the early part of the year. Accordingly, the 3-month (3.5%) and 6-month (3.2%) annualised rates are elevated to the annual pace, suggesting the Fed will need to wait for more reports similar to April before it will gain the confidence it needs to start cutting rates. 

Preliminary inflation estimates for May in the euro area surprised on the upside of expectations ahead of next week's ECB meeting. The ECB has effectively pre-committed to a rate cut, so the messaging around the policy outlook will be the main focus in light of the latest inflation data with markets pricing in 2-3 rate cuts by year-end. Headline inflation increased from 2.4% to 2.6%yr (vs 2.5% expected) and the core rate was also firmer at 2.9%yr (vs 2.7%) from 2.7% in April. Higher inflation readings were driven by a lift in services inflation (3.7% to 4.1%yr), and this could form the basis of a cautious tone from the ECB regarding rate cuts beyond June.

An uptick in Australian CPI inflation to 3.6% in April from 3.5% in March defied expectations for a softer reading (3.4%). This was accompanied by a firming in the trimmed mean (or core) measure from 4% to 4.1% (see here for a full review of the CPI report). Rates markets repriced on the release to reflect expectations for a lengthy hold from the RBA until the second half of next year. However, there is scope for a dovish reappraisal next week with the Q1 GDP growth figures due on Wednesday. My detailed preview of the National Accounts (see here) outlines that a continuation of subdued growth in early 2024 is likely as households remain under pressure from the cost of living and increased mortgage repayments. Those dynamics were reaffirmed by a weaker-than-expected 0.1% rise in retail sales in April (see here). 

Construction activity data contracted by 2.9% in Q1 (see here) as the detail indicated home building weighed further on economic growth. Engineering activity, mostly related to infrastructure, (-2.7%) and non-residential building (-7%) - components that have bolstered growth in recent quarters - saw output slow in Q1. Remaining on the construction theme, dwelling approvals held around 12-year lows on the back of a modest (-0.3%) decline in April (see here). At this stage, business investment shapes as the main driver of growth in Q1. Strength in equipment investment (3.3%) led private sector capital expenditure to advance by 1% in the March quarter (see here). Firms' forward-looking capex plans appeared broadly consistent with a constructive outlook for investment. Plans for 2024/25 were upgraded by 6.8% to $155bn, an 11-year high. 

Thursday, May 30, 2024

Preview: GDP Q1

Australia's National Accounts for the March quarter are due to be published by the ABS at 11:30am (AEST) today (5 June). Economic headwinds intensified as 2023 progressed, leading to a continuation of subdued growth in early 2024. Expectations are for GDP growth of around 0.2% in the March quarter. The key dynamic remains around the consumer, under pressure from the higher cost of living and the transmission of the RBA's tightening cycle. 

A recap: Growth slowdown extended into year-end 

Real GDP growth was 0.2% in the December quarter and 1.5% in year-ended terms, marking a material slowing of momentum in 2023. Alongside the strong rebound in population growth post the pandemic, output in per capita terms has contracted. Meanwhile, despite picking up over the back half of the year, measured productivity growth was also weak in 2023. 


Household consumption growth had effectively stalled by year-end, the driving factor behind the economic slowdown, as pressures from the higher cost of living, rising tax payments, and interest rate rises intensified. In response, households curbed demand for discretionary-related goods and services over the past year (-1.6%) to continue to purchase the essentials (1.2%). 


Dwelling investment has weighed on growth over the past year. Rising prices for labour and materials, trade shortages, and higher interest rates have all contributed to weakness in home building activity. Business investment (8.3%Y/Y) and public demand (4.7%Y/Y) remained strong, with these components underpinning economic growth. Key factors behind this strength have been non-residential construction work and the pipeline of public infrastructure projects. Net exports had also supported growth on the back of spending by overseas tourists and students.  

A preview: Domestic demand remains under pressure  

Growth in many advanced economies was subdued in early 2024, though the US remained the notable exception. In Australia, the incoming data has pointed to another soft outcome for quarterly growth. Pressures faced by households associated with the higher cost of living and tighter monetary policy continued to weigh on consumption growth in Q1. Retail sales volumes declined in the quarter and other indicators of discretionary spending showed further weakness. 


Conditions in the labour market continued to remain broadly resilient to slowing growth. Employment reaccelerated to post its strongest quarterly increase in 12 months. Alongside the boost to participation from the growth in the population, the strength in employment helped to limit the rise in the unemployment rate to around 4% from the cycle lows of 3.5% in late 2022. Broader measures of labour force underutilisation have also softened but remain at historically low levels. 


Disinflationary progress lost momentum in early 2024 - not unlike the US - though there were signs that wages growth had peaked and recent productivity outcomes had improved. The RBA has kept the cash rate unchanged since last November at 4.35%, maintaining that policy is restrictive and calibrated appropriately to gradually return inflation to the midpoint of the 2-3% target band. 


Despite the effect of higher interest rates, housing prices have continued to rise as strong demand associated with population growth has come against tight supply. Since reaching a cycle low in early 2023, the national median housing price has risen by more than 11%. The fastest pace of gains have come in the mid-sized Brisbane, Perth and Adelaide markets. Meanwhile, rental vacancy rates remain at very low levels across the nation.   

Source: CoreLogic 

Summary of key dynamics in Q1

Household consumption — Consumption growth remained subdued as cost-of-living pressures and higher interest rates continued to weigh on discretionary demand. Retail sales volumes contracted by 0.4% in Q1, driven by weakness in non-food volumes (-0.7%).   

Dwelling investment — Weakness persisted in residential construction activity in early 2024. New home building and alteration work declined, the latter retracing to late 2020 or pre-Covid stimulus levels. 

Business investment — Private sector capital expenditure expanded by a solid 1% in the March quarter, driven by a strong 3.3% lift in equipment investment.  

Public demand — Provided a broadly neutral impulse to growth in the quarter. Government expenditure continues to increase, though public investment has slowed. 

Inventories — Despite a weak demand backdrop, inventory rebuilding in Q1 added around 1ppt to quarterly growth. This is moderated by a 0.3ppt deduction from public sector inventories.  

Net exports — A 5.1% broad-based rebound in import volumes to drive a 0.9ppt deduction to growth from net exports. Export volumes lifted by a modest 0.7%. 

Australian dwelling approvals -0.3% in April

Australian dwelling approvals were near flat in April (13.1k) around broadly movements in house (-1%) and unit approvals (1.1%). Headline approvals remain around 12-year lows as higher interest rates and capacity pressures as well as other headwinds continue to impact the home building sector. 


Approvals eased by a modest 0.3% in April to 13.1k following a 2.7% rise in March (revised up from 1.9%). For the 3 months to April, approvals averaged 13k - a level on the lows for the cycle and weak in a historical context for Australia. This comes amid the well-documented surge in the population post the pandemic. However, the pipeline of dwellings under construction continues to remain very elevated; according to the ABS, at the end of 2023, there were 89.5k detached homes and 135.1k units under construction. Supply constraints have been a key factor leading to delays in the construction of these dwellings. 


House approvals declined by 1% in the month to 9k but are up by a little more than 9% over the past year. The strongest increases in house approvals through the past 12 months have come in the states of Western Australia (44.9%) and Victoria (16.4%). 


Unit or higher-density approvals were up by 1.1% in April to 4.1k, a decline of 7.5% on 12 months ago. Looking at the recent trends, the high-rise segment has been the main source of weakness, but townhouses have started to pick up. 


The value of alteration work approved firmed slightly in the month (0.4%) to $1.1bn. The elevated level of alteration approvals largely reflects inflationary effects; yesterday's construction activity data (see here) reported that the volume of alteration work completed has fallen back sharply to late 2020 levels. 

Wednesday, May 29, 2024

Australian Capex 1% in Q1; 2023/24 investment plans $181bn

Australian private sector capital expenditure increased by 1% in the March quarter, outperforming the 0.7% rise expected by markets. A strong rise in equipment investment (3.3%) drove capex higher through the first 3 months of 2024, providing a welcome boost to GDP estimates amid weak details around the consumer and the construction sector. Forward-looking investment plans were revised upwards in both the current financial year (to $181bn) and 2024/25 (to $155bn), the projected spend for the latter advancing to an 11-year high. 


Private sector capex - an indicator of business investment that feeds into GDP growth calculations - rose solidly by 1% in chain volume (or inflation-adjusted) terms in the March quarter. Year-ended growth slowed from 8.1% to 5.5% - capex spending was brought forward into the first half of last year ahead of the withdrawal of Covid-related tax incentives - so this is still a decent pace in that context. In the most recent quarter, equipment investment lifted by 3.3% to comfortably offset a 0.9% drag from spending on buildings and structures.   


Equipment investment in the non-mining sector lifted by 4.6%q/q - its strongest rise in 3 years - driving the overall increase in equipment spending. The ABS noted in today's release that this was supported by an expansion of investment in data centres by firms in the information media and telecommunications industries. Mining-related equipment investment declined 3.2%q/q. 


The details around buildings and structures investment included a 1.9% rise in the non-mining sector but a 5.2% fall in the mining sector. Overall, this netted out to a 0.9% decline for buildings and structures, an outcome against the recent strength in this component, largely consistent with the picture painted by yesterday's construction activity data (see here). 


Today's report contained firms' latest estimates of their capex plans in 2023/24 and 2024/25. For the current financial year, total investment was lifted to an expected spend (in nominal terms) of $181bn for estimate 6, an upgrade of 2.5% on the previous estimate from 3 months ago and tracking 11% higher on a year-to-year basis (relative to estimate 6 in 2022/23). 


Firms were also surveyed for their 2nd estimates of planned capex spending in 2024/25. The headline figure was $155bn, a 6.8% lift on estimate 1 from 3 months ago and 12.8% higher than estimate 2 for 2023/24. Inflationary effects are a factor in those upward revisions but this was nonetheless the highest estimate since 2013/14.   


Non-mining sector investment plans for 2024/25 increased by 6.8% (vs est 1) to $107bn, with upgrades coming through for both equipment (6.9% to $48bn) and buildings and structures (6.7% to $59bn). Meanwhile, mining sector plans advanced 7% to $48bn, with equipment spending projections rising 7.5% (to $13bn) and buildings and structures up 6.8% (to $35bn).   

Australian construction work done -2.9% in Q1

Australian construction activity declined sharply in the March quarter (-2.9%), defying expectations for a modest rise (0.5%). That result was attenuated somewhat an upward adjustment to activity in the previous quarter (revised from 0.7% to 1.8%); however, this was still a weak outcome from a key component of the economy that will feed into next week's growth figures for Q1. 


Construction activity went backwards in the first quarter of 2024 by 2.9% - the sharpest decline seen in almost 5 years. The result was driven by non-residential (-7%) and engineering work (-2.1%) rolling over from recent strength, while weakness in the residential sector (-1.2%) persisted. 


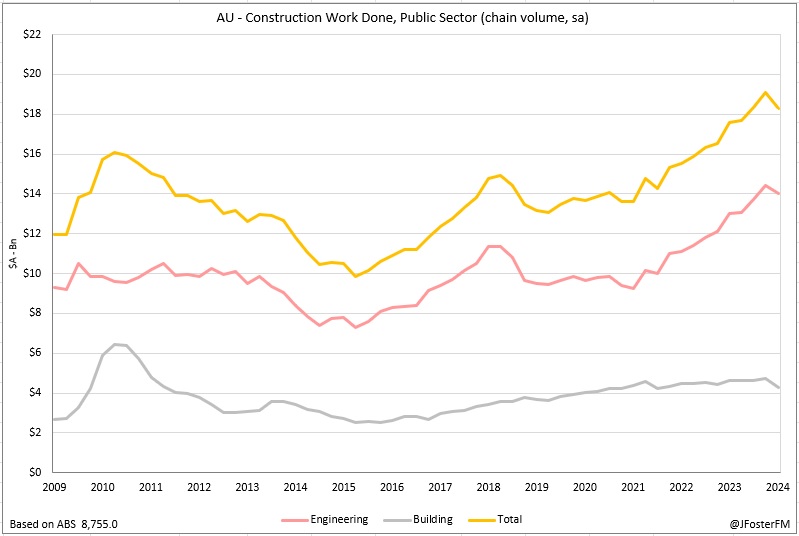
From a broader perspective, construction work done by the public sector - a major source of strength coming of out the pandemic on the back of a ramp up in infrastructure spending - unexpectedly fell (-4.3%), and private sector activity also declined (-2.4%). 


In the private sector, residential construction contracted by 1.1% in the March quarter to be down by 3% through the year. Activity in the segment is facing strong headwinds from labour and supply constraints - legacy issues from the pandemic - higher interest rates and affordability concerns. New home building declined by 0.8%q/q and by 1.7% over the year. Alterations (-2.7%q/q, -10.5%Y/Y) have retraced to late 2020 levels, pre the full weight of the Covid stimulus measures that supported this activity.  


Private non-residential work was down 6% for the quarter, albeit after an 8.9% surge in Q4. Activity in this segment remains at elevated levels nonetheless, supported by renewable energy and industrial projects. 


Engineering activity was down 2.1% overall in the quarter, slowing the increase over the year to 6.2% from 16.3%. The expansive pipeline of public infrastructure projects being undertaken by governments across the nation has boosted engineering activity across both the public (7.8%Y/Y) and private sectors (5%Y/Y). Public sector building work was reported to have contracted by a surprisingly large 9.2% in Q1, an outcome against its recent trend of rising activity.