Momentum in the Australian economy was strong ahead of a period of significant disruption and uncertainty associated with the emergence of the Delta variant and widespread lockdowns. Real GDP expanded at a faster-than-expected pace at 0.7% in the June quarter against the market consensus for a 0.4% rise. Eased restrictions and the continuing effects of significant policy stimulus measures drove output higher by 2.6% through the first half of the year, sustaining the momentum generated by the national reopening. Growth had accelerated to be 9.6% higher through the year, with the base period coinciding with the depths of the national lockdown at the onset of the pandemic.
Australian GDP in the June quarter was 1.6% above its pre-pandemic level at the end of 2019. The containment of the pandemic to low caseloads and significant fiscal and monetary policy stimulus had been key factors in the recovery. However, GDP remained below its pre-pandemic trajectory, based on the RBA's February 2020 forecasts, due to very low population growth, reflecting the impact of the closure of the international border — a major lever being used by the authorities in the pandemic response.

Global growth dynamics provided a supportive backdrop for Australia in Q2, with high vaccination rates and ongoing fiscal and monetary stimulus the key themes. Growth in the US economy increased slightly from the previous quarter to rise by 1.6% in Q2, seeing GDP rising above its pre-pandemic level. The economic recoveries in the euro area and UK got back on track in Q2 as activity surged on reopenings from extended lockdowns. In contrast, lower vaccination coverage amid the emergence of the Delta variant restrained the rebound in Japan from Q1's contraction. China's economy had expanded further above its pre-pandemic level, with the recovery being driven by the export sector and household spending. These factors were holding iron ore prices at elevated levels — a strong tailwind for Australian national income growth.

During the June quarter, the Australian economy continued its transition from the recovery to the expansion phase. Domestic demand conditions were very robust, contributing 1.6ppts to GDP growth in Q2. Private demand had added 1.0ppt to quarterly growth. Household spending remained supported by high accumulated savings, wealth effects from rising equity and housing prices and low interest rates, while a robust labour market was also a key contributor. Private investment was being supported by stimulus measures boosting residential construction activity and tax incentives were encouraging businesses to invest in new equipment to meet rising demand. Meanwhile, public demand was also supporting the expansion with projects being brought forward by state and territory governments as part of the stimulus response. Overall GDP growth in Q2 was moderated by disruptions to resources exports leading to a 1.0ppt subtraction from net exports and a drawdown on inventories (-0.2ppt).
The emergence of the Delta variant and associated lockdowns have since shifted the trajectory of the expansion significantly, as daily caseloads have risen to their highest levels of the pandemic. The early signs of this were evident in high-frequency indicators of household activity and mobility towards the end of Q2, while sentiment had also fallen from elevated levels. This was reflecting the impact of a two-week lockdown in Victoria between late May and early June and the commencement of the greater Sydney lockdown in late June.


In light of the sharp deterioration in the economy and rise in uncertainty that has followed, the RBA Board at its September meeting will be revisiting its decision to maintain its guidance to start tapering the weekly pace of its bond-buying from $5bn to $4bn from next week. With GDP likely to contract in the order of 3% in Q3 and with the current lockdown restrictions to remain in place well into Q4 in order to reach the 70-80% vaccination rates being targeted by the National Cabinet, a delay to the start of tapering is expected by markets.
— — —
GDP — Q2 | Expenditure: GDP (E) 0.4%q/q, 9.6%Y/Y
Household consumption (1.1%q/q, 15.4%Y/Y) — A solid pace of growth was maintained in the June quarter as household consumption advanced by a further 1.1% to be up 15.4% from last year's national lockdown.

The profile of consumption through the quarter remained consistent with spending patterns rebalancing to a reopened economy and eased restrictions. However, consumption growth was notably weaker in Victoria than in the other states and territories reflecting the impact of its two-week lockdown. A fourth consecutive quarter of outperformance in discretionary consumption (1.6%) compared to essentials (0.9%) pointed to the supportive dynamics for household spending from the rebounding labour market, high levels of optimism, wealth effects from strong balance sheets and low interest rates. The recovery continues to be driven by services consumption (1.3%q/q), with strength in transport services (25.5%q/q) reflecting the boost to domestic tourism from the Federal Government's discounted airfares scheme, and hotels, cafes and restaurants (2.2%q/q) benefitting from Australians going out and about more. Goods consumption advanced in Q2 (0.9%), more than reversing a decline in the previous quarter. Very strong demand for new vehicles continued with a 7.5%q/q rise to be up by nearly 60% since the national lockdown. As at Q2, household consumption was just short of returning to its pre-pandemic level (-0.3%) around an uneven mix. Spending in essentials (2.1%) and goods (6.3%) was elevated but discretionary (-4.1%) and services (-4.1%) were still substantially down on pre-COVID levels.

Real household disposable income contracted in Q2 (-1.0%) reflecting the wind-down of the JobKeeper wage subsidy at the end of March and substantially lower social assistance payments (-10%), with both factors highlighting the strength of the recovery in the labour market. With household consumption advancing alongside a fall in disposable income, there was a draw down on the high level of accumulated savings Australians have at call. The household saving ratio fell from 11.6% to 9.7% but remains very elevated to the levels seen in the years preceding the pandemic.
Dwelling investment (1.7%q/q, 15.7%Y/Y) — Activity in residential construction work slowed to a 1.7% rise in Q2 following the surges of 4.0% in Q4 and 7.5% in Q1. This possibly reflected some capacity constraints in the sector amid the strong upswing in the residential construction cycle, driven by policy stimulus from the HomeBuilder scheme, first home buyer incentives and low interest rates. This was in sharp contrast to the period of sustained weakness in the years prior to the pandemic.
Alterations lifted by a further 1.9% in Q2 to be up by 27.4% through the year. In addition to policy stimulus, dynamics associated with the pandemic through working from home arrangements and the unavailability of offshore travel were likely boosting renovations, as were the effects from rising housing prices. New home building expanded by 1.6% in the quarter, driving annual growth to 8.7% — its strongest in 3 years.
The robust conditions in the major housing markets across capital cities and regions led to another surge in ownership transfer costs — relating to fees associated with real estate transactions — with a 10% rise coming through in Q2 to be 38% above pre-pandemic levels. This has added almost 1ppt to economic growth over the past year.
Business investment (2.3%q/q, 6.2%Y/Y) — Supportive dynamics from the strong economic recovery, the extension to the temporary full expensing and loss carry-back provisions in the recent Federal Budget, accommodative financing conditions and strong sentiment continued to drive business investment, lifting 2.3% in Q2 to be 6.2% higher through the year. Equipment investment increased by a further 2.4% for the quarter and is substantially higher than its pre-pandemic level, up almost 8% over the period. Investment in intellectual property products continued to lift at a solid pace posting a 2.3% rise following gains of similar magnitude in the previous three quarters. Non-dwelling construction saw its strongest quarterly rise in nearly 2 years (2.3%) but remained at a low level.
Overall, non-mining investment was rebounding but was still below pre-pandemic levels (-2%) while mining investment remained subdued despite surging commodity prices.
Public demand (1.9%q/q, 5.8%Y/Y) — Growth in public demand remains robust with governments at the federal and state levels bringing forward projects to support the economic recovery. Underlying investment advanced by 4.7% in Q2, driving growth through the year to 15.2%. Consumption spending increased by 1.3% for the quarter, with health-related spending associated with the pandemic response remaining prominent.

Net exports (-1.0 ppt in Q2, -3.6ppts yr) — Net exports remained a sizeable drag on overall activity, subtracting 1.0ppt from GDP in Q2. Exports contracted by 3.2% in Q2 as resources volumes declined sharply (-5.9%) in response to adverse weather conditions and maintenance activity. Meanwhile, imports continued to rise (1.5%q/q) in line with the strength in domestic demand conditions. Compared to pre-pandemic levels, exports remain materially lower (-13.9%) with services crunched (-45.6%) by the international border closure, affecting the tourism and education sectors. Imports are 5.4% lower than at the end of 2019, with surging goods volumes (10.5%) providing offset to the weakness in services (-55.3%) associated with the offshore travel ban.
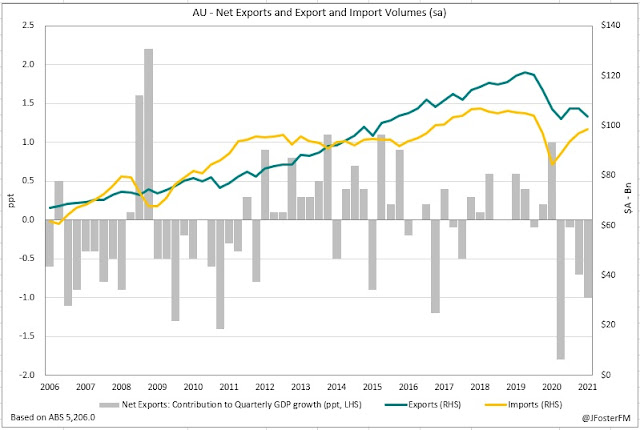
Inventories (-0.2ppt in Q2, 1.4ppts yr) — Inventories were being rebuilt over recent quarters with the economy recovering from the COVID recession, however that stalled in Q2. Notwithstanding, inventories were a smaller-than-expected drag on quarterly GDP. Private non-farm inventories subtracted 0.7ppt from activity, though that was moderated by builds in inventories from public authorities (+0.35ppt) and farms (+0.15ppt).

— — —
GDP — Q2 | Incomes: GDP (I) 0.6%q/q, 9.6%Y/Y
The June quarter estimate for real GDP income lifted by 0.6%, coming in between the expenditure and production outcomes, with annual growth soaring to 9.6% from 0.9%.
National income continued to surge on the tailwinds from elevated commodity prices and the recovery in the domestic economy. Nominal GDP advanced by 3.2% in Q2 (16.4%Y/Y) to be 7.8% above its pre-pandemic level.
Robust industrial demand from China and the global economic recovery effort have driven prices for Australia's key commodities substantially higher, notably for iron ore, more than offsetting the weakness in volumes from the disruptions in shipments to markets offshore. In response, the nation's terms of trade have been elevating and reached a record high in the June quarter on the back of a 6.9%q/q rise; its level now 23.8% higher than pre-pandemic.
With the domestic economic recovery making stronger-than-expected progress and the boost coming through from high commodity prices, fiscal support through the JobKeeper program concluded and assistance from the Boosting cash flow for employers measure reduced further. Government taxes less subsidies lifted by $5.8bn in Q2 to $51.5bn, which was a little higher than prior to the onset of the pandemic.
With fiscal support unwinding, small business profits have continued to retrace from last year's highs. Gross mixed income declined by 0.7% in Q2 as base effects swung annual growth to -8.1% from 11.3%. Private non-financial operating surplus was 6.4% higher for the quarter on the back of surging mining profits (18.4%q/q). Financial corporations profits posted a 1.5% rise in Q2, lifting annual growth to 4.7% from 2.1%. Low interest rates have been a headwind for the sector over recent years.
The strength in labour market conditions continued to be reflected in wage incomes. With the unemployment rate and broader rates of underutilisation falling to their lowest levels in many years during the quarter, wages and salaries increased by another 1.3% in Q2 and were 6.8% higher than at the depths of the COVID recession.
— — —
GDP — Q2 | Production: GDP (P) 0.9%q/q, 9.6%Y/Y
The GDP production estimate in the June quarter advanced by 0.9% as growth through the year accelerated from 1.4% to 9.6%.
From a broad sector perspective, services industries are driving the recovery as goods-related industries lag. Spending patterns rotating to a more open economy on eased restrictions has been the key theme. Gross value added (GVA) in services lifted by 1.3% in the quarter (11.9%Y/Y) to be 1.8% higher than pre-COVID. The goods sector saw a 0.7% lift in quarterly GVA but remained below end 2019 levels (-0.7%).
In the goods sector, GVA in the goods distribution segment was up by 1.9% in the quarter. This was driven by the transport industry (3.7%) in response to increased tourism travel associated with open state borders and the Federal Government's discounted airfares scheme, and wholesalers (1.1%) on strong demand for new vehicles. Goods production was near flat on the quarter (0.1%), held back by the maintenance activity in the mining sector (-1.3%) that moderated increases from the construction and manufacturing industries.
Turning to services, household services posted a 1.5% rise in GVA in the quarter to be 2.2% above its pre-pandemic level. Contributing to the rise was health (2.0%) on increased appointment volumes, other services (2.0%) led by vehicle maintenance, and arts and recreation (0.4%) with eased restrictions driving increased foot traffic at gambling facilities. GVA from business services lifted by 1.2% in Q2 and was 1.5% above pre-COVID levels. Gains came through in finance (0.8%) on increased home loan activity, rental and real estate (1.8%) due to the robust housing market and rising demand for rental cars associated with increased domestic tourism. The complete industry analysis is shown below.

— — —
GDP — Q2 | Prices
There were signs of a firmer inflationary pulse in the June quarter. Economy-wide inflation on the GDP deflator was sharply higher rising by 2.5% in Q2 — its fastest quarterly rise in 11 years — to 6.2%Y/Y, with the latter boosted by base effects. This factors in the strong lift in the terms of trade in the quarter (6.9%). Adjusting for the terms of trade effect, the gross national expenditure deflator showed a more moderate rise of 1.0% in Q2 (1.5%Y/Y), though that was its strongest quarterly lift in 9 years.

Growth in the household consumption deflator — the closest proxy in the national accounts to the CPI — firmed to 0.7% in Q2 from 0.5% in the previous quarter, as annual growth returned to around pre-pandemic rates at 1.5%. For comparison, seasonally adjusted CPI was 0.8% in Q2, with annual growth boosted from 0.9% to 3.7% on base effects.
The productivity measures have been buffeted around by lockdown and reopening effects over the past year and will remain subject to this volatility over the coming quarters. Hours worked across the Australian economy were up by 1.9% in the June quarter for growth of 10.3% since the national lockdown. Hours worked in the market sector advanced by 2.3% for Q2 to be 12.4% higher through the year. Compared to their pre-pandemic levels, total hours are down 0.5% and are 1.4% lower in the market sector.

— — —
GDP — Q2 | States
New South Wales saw growth in state demand firm to 2.2% in the June quarter from 1.9% in Q1. State demand had lifted to 3.2% above its pre-pandemic level, though that will be setback significantly by the lockdowns that struck late in Q2. Growth in household consumption increased at a 2.1% pace for Q2, with cafes, restaurants and entertainment venues (4.3%) supported by the government's Dine and Discover voucher scheme. Business investment advanced by 3.1%q/q on the continued surge in equipment spending. Activity in residential construction elevated further (1.1%q/q) to be 11.6% higher than pre-COVID levels — alterations surging over the period (34.7%). Public demand has been an ongoing source of strength, up 5.9% through the year.
Victorian state demand slowed sharply to 1.4% in Q2 from 2.6% in the previous quarter on the effects of a two-week lockdown in late May to early June. As the state most affected by lockdowns, the recovery in state demand has been notably slower than other jurisdictions. Household consumption was little more than flat in Q2 (0.1%) with the retail sector hit by temporary closures. Residential construction declined modestly in the quarter (-0.7%) as alteration work moderated (-2.9%) after Q1's surge (11.3%). Driving state demand was business investment (4.4%q/q) on rising equipment spending and a lift in engineering work, with the latter boosted by public spending in road and rail projects.
Moving to the other states, Queensland state demand increased in pace to 2.0% in Q2 after a modest lift in Q1 (0.3%), bringing it to 4.4% above pre-pandemic levels. Gains were broad-based across the components reflecting less disruptions from lockdowns and the impact of stimulus measures. In particular, business investment was up 7.8%q/q and residential construction activity lifted 2.3%q/q. South Australian state demand posted another solid outturn lifting by 1.8% in Q2. Household consumption, residential construction and business investment have all recovered to be above pre-pandemic levels.
In Western Australia, state demand advanced by 1.2%q/q to be 5.7% above its level at the end of 2019. Household consumption gathered pace in the quarter (1.9%). Very robust conditions in the housing market and stimulus support continues to boost residential construction (4.5%q/q), with both new home building and alterations up more than 4% in Q2. State demand in Tasmania posted growth of 1.4% in Q2, a similar pace to Q1 (1.7%). Residential construction and business investment in the state is significantly higher than prior to the pandemic on stimulus measures, though household consumption is still recovering, reflecting the impact on tourism from travel restrictions. Public demand continued to rise (3%q/q), led by road projects.


