Independent Australian and global macro analysis

Wednesday, April 30, 2025

Australia's trade surplus widens to $6.9bn in March

After narrowing to a 4½-year low in February ($2.9bn), Australia's goods surplus widened to a 13-month high of $6.9bn in March, more than double the $3.1bn consensus estimate. This was driven by the fastest rise in exports (7.6%) in nearly 3 years, boosted by US exports to front run the Trump administration's trade tariffs. Meanwhile, imports posted their sharpest decline in 6 months (-2.2%). Separately, the ABS reported that export prices rose by 2.1% in the March quarter while import prices lifted by 3.8%, with Australian dollar depreciation a key factor.         


The goods surplus defied a narrowing trend to widen to its highest level in 13 months at $6.9bn in March. On the back of this result, the 3-month average for the goods surplus lifted off a 54-month low ($4.3bn) to $5bn. Cumulatively, the goods surplus was $15.1bn across Q1, moderating from the prior quarter ($16.3bn).    


Exports accelerated by 7.6% for the month in March to $45.3bn, rising by 2.4% over the first quarter of the year. Notably, US-bound exports lifted by 8.6% to $5.6bn, surging during the opening months of 2025 ahead of the Trump administration's impending tariffs. 


In March, exports were led by growth in non-rural goods - a category dominated by the major resource exports - and non-monetary gold. Non-rural goods rose by 8.6% in the month to post their fastest rise since April 2022, with large increases coming through in iron ore (11.6%) and coal (10.7%). The ABS's trade price release today reported that economic stimulus measures in China and weather-related disruptions in Australia put upward pressure on commodity prices. A continuation of safe-haven demand amid volatile market conditions underpinned another steep rise in non-monetary gold (25.9%).


Imports were down 2.2% in March to $38.4bn but still lifted by 3.8% across the first quarter. In the latest month, weakness came through in all major categories, pulling back after gains in February: consumption goods (-0.7%), capital goods (-5.1%) and intermediate goods (-2.1%).  

Tuesday, April 29, 2025

Australian Q1 CPI 0.9%, 2.4%Y/Y

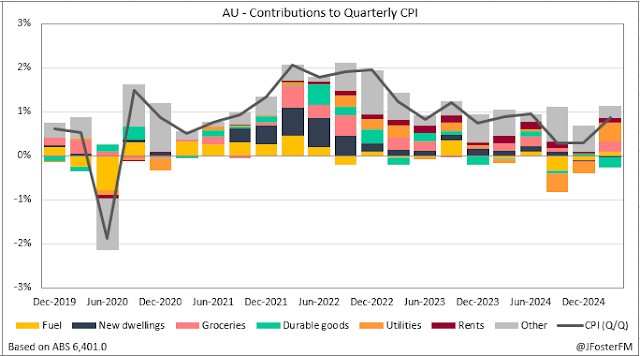
Australia's key March quarter CPI outcomes surprised slightly to the upside of consensus, but today's report has kept pricing for an RBA rate cut in May well anchored. Although quarterly headline CPI ticked up from 0.2% to 0.9% (vs 0.8% expected) as government electricity rebates unwound, the annual rate held at 4-year lows of 2.4% (vs 2.3%). Meanwhile, a softening in the trimmed mean CPI from an upwardly revised 3.3% to 2.9% year-on-year (vs 2.8%) confirmed core inflation is now back inside the RBA's target band and at its slowest pace since late 2021.   


Headline CPI in the March quarter rose to 0.9%, up from increases of 0.2% in each of the back two quarters of 2024. Government subsidies to reduce cost-of-living pressures started to wear off in the first quarter, pushing inflation higher. 

Electricity prices were the key driver, measured to have risen by 16.3% in the quarter, after declining by more than 25% over the previous two quarters on the combined effects of federal and state government rebate schemes. Rises in health (2.9%q/q) and education costs (5.2%) reflecting seasonal factors also put upward pressure on inflation. The other key price increases were in groceries (1.2%) and fuel (1.9%), with rents also up (1.2%) following changes to the federal government's assistance scheme.
 
At the other end of the scale, weaker demand saw items including international holiday travel (-7.6%), furniture (-5.5%) and AV equipment (-1.2%) pushing down on inflation in Q1. 


Away from the quarterly price movements, the key development was that price pressures across the core of the basket continue to ease. Trimmed mean or core inflation slowed from 3.3% to 2.9% year-on-year, a low since Q4 2021. In 6-month annualised terms, core inflation is sitting right on the midpoint of the RBA's target band at 2.5%, its softest run rate going back to Q3 2021. 


To further back up an easing underlying inflation dynamic, services inflation - a key area of the CPI basket the RBA has been tracking - is also slowing. In the latest quarter, services inflation was 0.8% - a slight uptick from Q4 (0.7%) - but the annual pace fell from 4.3% to 3.7%, its slowest since Q2 2022. 

Preview: Australian Q1 CPI

Australia's CPI inflation report for the March quarter is due from the ABS this morning (1130 AEST). With further disinflationary progress expected to have occurred in early 2025, markets go into today's report priced for a second 25bps rate cut for the easing cycle from the RBA at the next meeting on May 20, after the cut in February.    

March quarter preview: Disinflationary progress to continue

Although government rebates on electricity bills are unwinding, disinflationary progress still likely continued in the March quarter. After consecutive increases of 0.2%, quarterly headline CPI is forecast to tick back up to 0.8% in Q1 (range: 0.7-0.9%); however, with a higher outcome in the base period falling out of the annual calculation, the year-on-year pace is expected to ease from 2.4% to 2.3%. Core or trimmed mean CPI is anticipated to firm from 0.5% to 0.6% quarter-on-quarter, but as with headline CPI, base effects see the consensus figure lower at 2.9% year-on-year from 3.2% last time out. 


The main source of volatility in Q1's inflation outcomes is likely to be in electricity prices. Timing differences between when the various federal and state government rebates schemes have been applied in each state makes the movement in electricity prices in the quarter difficult to predict. Measured electricity prices rose by around 6% over January-February in the monthly CPI series; assuming that rate of increase held in March, electricity prices could rise in the order of 12% across the quarter. 


Another area to watch is food prices after ex-Tropical Cyclone Alfred hit south east Queensland and Northern New South Wales in March. Both fruit and vegetable prices lifted by 3.3% in January, movements that were only partially reversed by declines in February. Meanwhile, new dwelling costs are also key, particularly for core inflation. Although modest, home building costs started showing declines over January-February. 
  
A recap: Inflation ends 2024 at 3-year lows

A disinflationary impulse renewed by government subsidies saw both headline and core inflation end 2024 at their lowest rates in at least 3 years. Headline CPI was 0.2% in the December quarter and 2.4% year-on-year, down from 2.8% previously. Trimmed mean CPI was 0.5% in the quarter, coming in from 3.5% to 3.2% through the year. With annual inflation running either side of the top of the target band (2-3%), the RBA went on to cut rates early in the new year.  


Government rebates on household electricity bills and lower fuel prices have been the key items that renewed the disinflation impulse, which had essentially stalled by the middle of last year. Additionally, new housing costs were also contributing less to headline inflation as developers had increased incentives following the effects of higher interest rates in weakening demand. 


Although inflation in services categories has moderated it remains the major driver of inflation. Input cost pressures, including from labour costs, were a key cause of rising services inflation, with strong demand allowing firms to pass through those increases in higher prices. However, a weaker demand backdrop has seen many firms now having to absorb more of the increases in their input costs in profit margins. 

Friday, April 25, 2025

Macro (Re)view (25/4) | US equities rebound

A more market friendly tone from the Trump administration on trade and Fed independence saw US assets finding form this week, with spillover effects across broad markets. Benchmark US equity indices rallied between 4.6% and 6.7% this week, bringing the S&P500 to within 2.6% of its April 2 'liberation day' level; the Nasdaq, meanwhile, has more than recovered its recent falls to be around 1.3% higher over that period. However, despite the improving equity performance, a risk premium remains embedded in the USD, with the DXY index more than 4% lower since liberation day. A weaker dollar hurts the US economic outlook through higher imported goods prices in addition to the tariffs. Consequently, the expectation for Fed easing is reflected in the front end of the Treasury curve, with the 2-year yield trading at 3.75% - down from around 4.3% at the start of the year. 


In a holiday-shortened and much quieter week for headlines, markets looked to the preliminary readings of April's PMI surveys as a guide on the early impacts of President Trump's tariff announcements on activity. In the US, activity on the headline gauge fell from 53.5 to 51.2, indicating growth slowed in April to a 16-month low. More significantly, prices paid spiked - the inflation rate in the manufacturing sector lifted to its fastest pace in 29 months - as firms reported facing higher import prices and pressures from labour costs. The tariff impacts were less visible in the euro area - headline activity in the bloc eased from 50.9 to 50.1 - but in the UK export orders slumped by their most in almost 5 years, sending the headline index into contraction (48.2) for the first time in 18 months.  

The overall picture that tariffs will weigh on growth was reflected in downgrades to the IMF's global growth forecasts. The group cut its projection for growth this year from 3.3% to 2.8%, with the US outlook slashed from 2.7% to 1.8%. It also raised its probability for a US recession in 2025 to a 37% chance. The expected effects of tariffs on inflation are much more uncertain: although the IMF noted that weaker global growth will lead to disinflationary forces, tariffs are a supply shock that weighs on productivity and decreases competition, pushing up production prices - as the PMI data showed this week. 

Wednesday, April 16, 2025

Australian employment 32.2k in March; unemployment rate 4.1%

Australian employment increased by a little over 30k in March, not quite matching the 40k rebound expected after February's shock 53k decline. This saw the national unemployment rate creeping up to 4.1%, leaving pricing for an RBA rate cut in May fully intact. Attention on the data front now turns to the Q1 CPI report at the end of the month for the final green light. 
  
By the numbers | March
  • Employment increased by 32.2k in March (full time 15k/part time 17.2k), falling short of the 40k rebound expected following February's surprise fall (-57.5k).
  • Rounding saw the headline unemployment rate reported at 4.1% in March (4.05%), up from 4.0% in February (4.04%). The broader underemployment (5.9%) and underutilisation rates (9.9%) were unchanged from February's levels. 
  • Labour force participation failed to rebound from the sharp decline in February, remaining at 66.8%. 
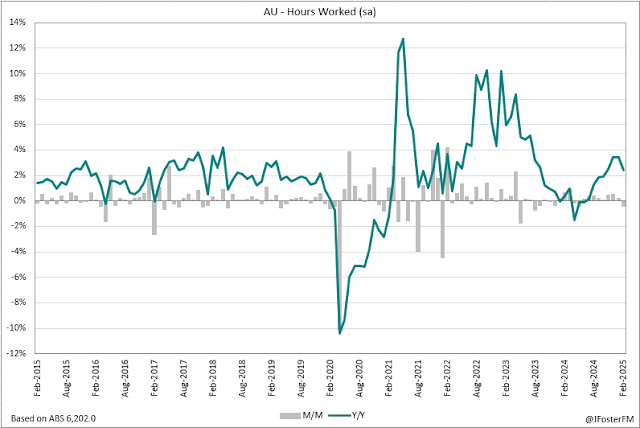
  • Hours worked were down by 0.3% nationally in March (0.7%yr), driven by the disruptions from ex-Tropical Cyclone Alfred in Queensland (-3.8%) and New South Wales (-1.3%). This followed February's -0.4% fall.  


The details | March  

The expected rebound in employment in March fell short of expectations rising by 32.2k as February's decline was revised to -57.5k from -52.8k. Employment gains were spread evenly across the full time (15k) and part time segments (17.2k), the latter more than reversing its fall last month (-13.6k) while the former disappointed in light of its February decline (-43.8k).


Across the quarter, employment rose by just 6.5k - its weakest outcome outside the covid period since Q3 2016. Given that employment came into the year with strong momentum, this was a surprisingly weak result; the 3-month average slowed from a solid 30.1k at the end of 2024 to just 2.2k by March. But given the elevated volatility in the series in Q1 - with monthly outcomes of 31.7k (January), -57.5k (February), and 32.2k (March) - it may be more noise than signal. 


The headline unemployment rate crept up from 4.0% to 4.1% in the month, although that was due to rounding with the level of unemployment (613k) near unchanged on the prior month. Meanwhile, underemployment (5.9%) and total underutilisation (9.9%) held unchanged rates from February. Across Q1, unemployment averaged 4.1% - a slight uptick from 4.0% in the prior quarter - but the average levels declined for underemployment (6.1% to 5.9%) and underutilisation (10.1% to 10%) over the period. 


The main surprise in my reading of today's report was that the participation failed to rebound, holding at 66.8% after falling sharply from record highs in January (67.2%). Meanwhile, the employment to population ratio - the share of Australians of working age in employment - was steady at 64.1%, the lower end of its range of the past couple of years. 


Nationally, hours worked declined for the second month running - a 0.3% fall for March following the 0.4% slide in February - with base effects reducing annual growth from 2.4% to 0.7%. In the latest month, the fall was attributable to the disruptions caused by ex-Tropical Cyclone Alfred that saw hours worked falling sharply in Queensland (-3.8%) and to a lesser extent in New South Wales (-1.3%).


In summary | March 

Employment made a soft start to 2025, slowing notably from the momentum it had into the end of last year. But there are reasons to be cautious in rushing to assessments after one volatile quarter, and employment could quite conceivably bounce back in Q2. Overall, conditions in the labour market still appear fairly robust, with the unemployment rate remaining at a low level alongside elevated participation; however, there are now those lingering questions over employment growth going forward into the headwinds of the US's tariff war.  

Preview: Labour Force Survey — March

Australia's labour force survey for March is due to come across the screens at 1130 (AEST) today. February saw a shock result with employment declining by almost 53k; however, with statistical noise at a heavy volume in that report, markets are looking for a rebound of 40k for March. A sizable fall in labour force participation from record highs helped keep the unemployment rate stable at 4.1% in February, but a reversal today could see it rise to 4.2%. 

March preview: A return to normality expected 

Seasonal volatility and a wave of retirements made for a noisy labour force report last time out, so today's figures for March should give a more settled read on conditions. That said, the disruptions caused by ex-Tropical Cyclone Alfred in early March were significant in south east Queensland and northern New South Wales, which may have some effect on the national snapshot. 

In today's report, employment is expected to rise by 40k (range: 20-65k), rebounding from the shock 52.8k fall in February. My estimate for the previous report was for a 55k rise, so I will stick with that forecast on the view that the numbers will settle. The unemployment rate is anticipated to lift from 4.1% to 4.2% alongside a reversal of the large 0.4ppt decline in the participation rate seen in February to 66.8%.  


February recap: Shock employment fall but unemployment rate holds at 4.1%   

February's 52.8k decline in employment could hardly have come as a bigger shock with markets expecting a post-holiday rise of 30k driven by workers moving into new roles. Employment in both segments declined: full time -35.7k and part time -17k. This was the weakest monthly read on employment since December 2023, with the ABS's release note highlighting the impact of a wave of retirements coming into effect early in the new year.  


Consistent with increased retirements, a sharp retracement was reported in the participation rate to 66.8%, down from record highs of 67.2% in the prior month. As a result, the unemployment rate held at 4.1% - despite the large fall in employment. Adding to the noise in the report, broader measures of spare capacity in the labour market declined in February: underemployment 6% to 5.9% and underutilisation 10.1% to 9.9%.  


Hours worked fell by 0.4% in February - perhaps an even greater surprise than the employment result given hours typically rebound after falling through the peak summer holiday period in January. On this occasion, January hours were revised to a 0.2% lift from a 0.4% decline reported initially. Base effects saw annual growth slow from 3.5% to 2.4%.

Friday, April 11, 2025

Macro (Re)view (11/4) | Dollar tumbles; yields surge

President Trump's 90-day tariff delay came alongside a significant deterioration in the trade war between the US and China, leading to another hugely volatile week in broad markets. The White House says it has raised tariffs placed on China to 145%, which Beijing has countered with a 125% tariff rate. A sudden stop to trade between the world's two largest economies will have ripple effects more broadly on demand and supply conditions. US equities ended the week higher, but a negative rerating of the US outlook was clear in FX and fixed income. The dollar belied its reserve status, behaving more like an EM currency as it fell below the 100 level for the first time since mid-2023 alongside a brutal selloff in the Treasury market, over the week the 2-year yield lifted by 31bps - despite 3 Fed cuts expected by year-end - while the 10-year yield surged 50bps. Safe-havens CHF and JPY have been favoured, but equally the more cyclically exposed EUR and AUD have gained significantly. Meanwhile, higher daily fixings have indicated China is weakening the Yuan as part of its response to the trade war.  


In any other week, a cooler-than-expected US inflation report would have been the major story; however, it was largely dismissed by markets given the looming impacts to prices from tariffs. This was captured in the University of Michigan consumer survey where year-ahead inflation expectations shot up to 6.7% - the highest reading since 1981. Headline CPI declined 0.1% month-month in March (vs 0.1% expected), slowing from 2.8% to 2.4%yr (vs 2.5%). This was backed up by a weaker reading in the core series at 0.1%m/m (vs 0.3%) and 2.8%yr (vs 3%), down from 3.1% previously.  

Comments from RBA Governor Bullock on the global situation were kept brief during a non-policy related speech on Thursday. A 25bps cut is a lock for the 19-20 May meeting, but a message of stability from the governor gave no sense the RBA is thinking along the lines of a 50bps cut nor convening ahead of schedule to deliver an emergency cut as has been speculated. Instead, the governor said the RBA will take its time to work through various scenarios of what the tariff shock will mean for domestic growth and inflation. The early indications are that households have been unnerved by developments - the Westpac-MI index of consumer sentiment saw a sharp 6% fall in April - but the key for the RBA is in watching how this translates into household spending, business investment and hiring decisions. For businesses, the NAB survey in March business confidence was weak (-3) and conditions were moderate (+4) ahead of the tariff turmoil.  

Friday, April 4, 2025

Macro (Re)view (4/4) | Tariffs rough up markets

A regime change in global trade following the liberation day announcements of higher-than-expected tariffs sent shockwaves through markets this week. Equities were down 8-10% across the US, Europe and Japan - a near 4% fall in Australia looking small in comparison - as investors read the announcements as an impending shock to growth. The expectation is that this will require a response from central banks - the Fed outlook was repriced to 4 cuts by year-end - although that will be complicated by the upward adjustment to prices in the US tariffs will likely drive. In a speech on Friday, Fed Chair Powell stuck with the line that time will be needed to assess the appropriate course of action. Very rarely would a global growth scare lead to EUR appreciation vs the USD but that was the move that occurred this week, while global growth proxy AUD was hit hard.       


The Trump administration's liberation day announcements look set to raise the tariff impost levied by the US to its highest in a century. A 10% across-the-board tariff on nations (including Australia) will come into effect from April 5, while major trading partners have been dealt larger 'reciprocal' tariffs - China 34% (applied on top of earlier tariffs), Japan 24% and EU 20% - commencing April 9, with those rates based on a calculation of a country's trade surplus with the US as a share of imports from that nation, halved to get the tariff rate. Comments from the administration have indicated otherwise, but the scope to negotiate lower tariffs could be limited as the administration is thought to be planning on using revenue raised by the tariffs to fund tax cuts. 

While the March payrolls report was robust, the tariff situation means markets have little confidence in the outlook for the US labour market. Employment on nonfarm payrolls increased by 228k, well above the 140k consensus but with a -48k backward revision going through the numbers over January-February. The unemployment rate was broadly flat, but after rounding was reported to have lifted from 4.1% to 4.2%, which came alongside an uptick in labour force participation from 62.4% to 62.5%. Average hourly earnings at an annual rate softened from 4% to 3.8%. 

The RBA was firmly in wait-and-see mode at this week's policy meeting as the cash rate was left at an unchanged 4.1% (reviewed here). With the economy and inflation tracking broadly in line with the central forecasts published in February, a follow-up rate cut was not considered by the newly-formed Board. Governor Bullock said at the media conference that further confidence in the outlook for inflation to return to the midpoint of the 2-3% target band was key. In other news domestically this week, retail sales lifted 0.2% in February (see here); dwelling approvals flatlined from recent gains (see here); and the trade surplus narrowed sharply to lows since 2020 (see here). 

Wednesday, April 2, 2025

Australia's trade surplus narrows to $3bn in February

Australia's goods trade surplus came in sharply below expectations to $3bn ($2.97bn) in February, its narrowest since August 2020. A 3.6% fall in exports was the weakest outturn in 5 months and came on the eve of the Trump Administration's 'liberation day' announcements of global tariffs, which included a 10% tax on Australian goods entering the US and an embargo on domestic beef. Imports lifted 1.6% on the month to press new record highs.     


The surplus on goods trade narrowed from $5.2bn in January to $3bn in February, well below the $5.4bn figure expected. Although narrower trade surpluses have prevailed over the past 12 months, the February result was a step down from that. Off the back of this latest result, the 3-month average for the trade surplus narrowed from $5.4bn to $4.3bn - its lowest level since November 2020. 


Exports in the month declined by 3.6% to $42.3bn, a 6.6% fall across the past 12 months. The main movement in February came from non-monetary gold falling 21.4%, partially reversing its surge to record highs in January (78.6%) with market volatility and economic uncertainty fuelling demand. Non-rural goods fell 2.3% on weakness in iron ore (-2.9%) and coal (-6.7%).  


Rural goods advanced 4.4%, the notable movement coming in meat exports (19.7%) on some likely front-running of the Trump Administration's embargo announcement. Cereal exports (2.7%) rose for the 5th month in succession.    


As a side note, Australian exports to the US pulled back slightly in February following their surge in January, with orders brought forward ahead of liberation day.  


Imports in February posted a 1.6% rise to $39.3bn, a record high. Capital goods rose 3.6% while consumption goods saw a 1.2% lift. Meanwhile, despite a large decline in fuel imports (-14.8%) on the back of lower oil prices, intermediate goods were flat in February. Offsetting gains came through in industrial supplies and capital goods parts.    

Tuesday, April 1, 2025

Australian dwelling approvals -0.3% in February

Australian dwelling approvals were broadly flat in February (-0.3%) against expectations for a larger decline (-1.5%) following gains through December (1.5%) and January (6.9%). Approvals have trended higher over recent months, underpinned by the higher-density segment as high rise approvals have lifted in Sydney and Melbourne. Higher interest rates have weighed on home building activity over the past couple of years; and while the RBA has started easing policy, this will take time to flow through to the sector.   


February dwelling approvals (16.6k) were broadly unchanged from the prior month, at levels up more than 25% on 12 months ago. Approvals lifted by 8.5% across December and January, and with those gains, the 3-month average to February lifted to 16.3k - a high back to October 2022. However, seasonal effects potentially overstate the underlying strength and, as seen in today's result, some softer prints could now follow.    


Detached approvals were near-steady in February (0.2%) at 9.3k on a seasonally adjusted basis. This segment has seen a moderate rise over the past 12 months of 5.2% and the level remains low relative to the series history - particularly when considering the strong rate of population growth over the past decade. Notably in New South Wales and Victoria, house approvals have settled at levels below their ranges that prevailed in the years before the pandemic. 


Higher-density approvals saw a 0.9% decline in February, easing to 7.3k. This segment has driven much of the recent uptrend in approvals; higher-density approvals are up 67.5% across the past 12 months from levels near cycle lows. The major driver of this strength looks to have been in the high-rise category, mainly in Melbourne and Sydney.  


The value of residential alteration approvals (for house renovations) was 0.3% softer in February, with the level remaining elevated at just below $1.2bn. Meanwhile, non-residential approvals (-16.5%m/m) are showing signs of seasonal volatility - these approvals rose by 39% over November-December but have since fallen by 35% through January-February.   

RBA leaves cash rate steady in April

The RBA left the cash rate unchanged at 4.10% today (ES rate 4.0%). With the economy and inflation tracking broadly in line with the forecasts published just a little over a month ago, back-to-back cuts were never in contention. A rate cut is nearly 80% priced at the next meeting on May 20, but with underlying inflation still above the 2-3% target range and the labour market remaining robust, Governor Bullock again pushed back on market pricing for an easing cycle that discounts the cash rate to around 3.5% by year-end. 


Today's statement from the Board maintained the same key themes as in February: underlying inflation is moderating; the outlook remains uncertain; and sustainably returning inflation to target is the priority. Increased confidence that underlying inflation is returning to the 2-3% target opened the door to the cut in February and that progress has since been validated as the trimmed mean eased to 2.7% in the monthly CPI series. However, the Board is understandably cautious on the eve of the Trump administration announcing a swathe of trade tariffs.

In the post-meeting press conference, Governor Bullock said the RBA had been working through a range of scenarios to map out the likely impacts on Australia from a global trade war. In that event, growth was expected to be weaker but the effects on inflation were not clear. A new line was added into today's statement that noted 'monetary policy is well placed to respond to international developments if they were to have material implications for Australian activity and inflation'. 

Aside from the uncertainties offshore, domestically the RBA has question marks over how the labour market will evolve and the recovery in household consumption as cost-of-living pressures subside. Last week's federal budget included measures to ease those pressures and, while they were largely an extension of existing policies (energy bill rebates and tax relief), Governor Bullock saying that the Board considered those measures to be 'a wash' as they had largely been factored into the February forecasts should have raised a few eyebrows. The continuation of the energy bill rebates for an additional 6 months for example will have what the RBA would call 'mechanical effects' on inflation - holding it lower for longer before rising later on - and this cannot have been incorporated into the forecasts since the policy was only announced last week. 

The closing paragraphs reaffirmed the Board is taking a data-dependent approach to policy given the uncertainty around the outlook. In practice, this means the data that will come to hand over the coming weeks - wage and inflation updates for Q1 and additional labour market reports in particular - will be key to seeing the rate cut that is largely priced in for May delivered.