Independent Australian and global macro analysis

Wednesday, November 13, 2019

Australian employment -19.0k in October; unemployment rate 5.3%

Australian employment fell against expectations in October, posting its weakest monthly outcome in more than 3 years, while the national unemployment rate lifted back to 5.3%. 

Labour Force Survey — October | By the numbers
  • Employment on net fell by 19.0k in seasonally adjusted terms in October going completely against market expectations for a 16.0k increase. September's initially reported increase of 14.7k was revised down to 12.5k. 
  • The national unemployment rate lifted against expectations rising from 5.2% to 5.3%, to reverse the 0.1ppt fall from September. 
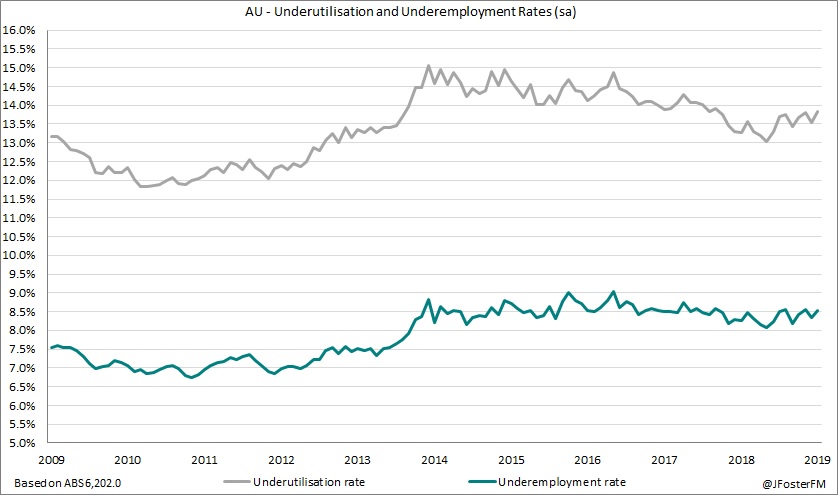
  • Underutilisation lifted from 13.5% to 13.8% and underemployment increased from 8.3% to 8.5%, with both measures handing back their declines from September.
  • The workforce participation rate fell by 0.1ppt 66.0% (exp: 66.1%).
  • Aggregate hours worked declined by 0.2% in October (prior 0.2%) to 1.78bn hours, while the annual pace slowed from 1.9% to 1.4%.  


Labour Force Survey — October | The details

Australia's unemployment rate lifted to its highest level in 16 months when taken at 2 decimal places after rising from 5.20% to 5.32% in October. The workforce participation rate decreased for the second consecutive month, easing by 0.1ppt to 66.0%; the last time participation recorded back-to-back falls was in February and March 2018. In absolute terms, this equated to a 1.9k decline in the workforce, and with employment falling by 19.0k the total of unemployed increased by 17.1k.

The 19.0k fall in net employment in October was the weakest outcome since August 2016 and was the first monthly fall in 17 months. There were declines from full-time (-10.3k) and part-time (-8.7k) work this month; the last instance of both segments falling in a month was in August 2016. These weak employment outcomes also saw underemployment (includes workers who want additional hours) and underutilisation (includes the underemployed and unemployed) rise to 8.5% and 13.8% respectively.  


Total employment growth in annual terms fell from 2.5% to 2.0%, though this includes a sizeable base effect (employment increased by 39.9k in October 2018). Growth in full-time work slowed from 2.2% to 1.6% over the year; in the first half of 2019 full-time was averaging increases of 19.7k jobs per month but this has decreased to just 8.3k so far for the second half. The pace of growth in part-time work was little changed at 2.9% from 3.0% last month. 


Aggregate hours work fell by 0.2% in October to 1.784bn hours, as annual growth eased from 1.9% to 1.4%. Making the adjustments to account for the decline in employment in the month, average hours worked per employee held steady at 138.1 hours (-0.6%Y/Y). 

  
Turning to the states, New South Wales' unemployment rate lifted from 4.5% to a 15-month high of 4.8%. Victoria's unemployment rate also stands at 4.8% after a 0.1ppt rise this month. Elsewhere, unemployment in Queensland (6.5%) and Western Australia (5.7%) held steady, while it fell from 6.3% to 6.2% in South Australia and from 6.2% to 5.9% in Tasmania. 


Employment growth has pulled back noticeably in New South Wales in recent months and is now neck and neck with Queensland for second place in terms of their year-ended contributions to national employment. Conditions in Victoria have been resilient to this slowdown, with the state accounting for around half of national employment growth so far in 2019. The details for October were; New South Wales -10.3k, Victoria +2.9k, Queensland -14.0k, South Australia -6.5k, Western Australia +6.3k and Tasmania +0.6k.   


Labour Force Survey — October | Insights

Today's report was a surprise and the details were much weaker than expected. Some perspective is required, though, considering that employment outcomes have outperformed market expectations by an aggregate of around 58k so far in 2019. Certainly, the forward-looking indicators have been pointing to a slowdown in employment growth for some time, which if this materialises will bring it closer towards growth in the working age population, thus making it more difficult for policymakers to lower the spare capacity that exists in the labour market. Not surprisingly, expectations for further RBA easing have firmed following this report, with another RBA rate cut looking likely in early 2020.  

Preview: Labour Force Survey — October

Australia's monthly update on the labour market is due to be released by the ABS at 11:30am (AEDT) for October. Markets expect employment to rise modestly in the month by 16.0k and for the unemployment rate to remain at 5.2%. 

As it stands Labour Force Survey 

Employment increased by a net 14.7k in September; broadly matching the consensus expectation of 15.0k to round out a robust quarter. In fact, employment on net increased by 87.6k in Q3 making it the strongest quarter since Q4 2017. Employment growth in annual terms remained at around a 2.5% pace, 
though a jump in the 3-month annualised pace from 2.3% to 2.7% suggests the momentum has strengthened recently.


The workforce participation rate remains around its highest level on record despite easing slightly from 66.2% to 66.1% in September. This equated to the workforce increasing by a modest 6.6k and as this was outpaced by the 14.7k lift in employment, the unemployment rate declined from 5.3% to 5.2%. Additionally, the underutilisation rate fell from 13.8% to 13.5% and the underemployment rate declined from 8.5% to 8.3% to more than overturn their increases from the previous month. Notwithstanding, the level of spare capacity in the labour market remains highly elevated and is consistent with yesterday's subdued update of the Wage Price Index for Q3 (see here).    


Growth in aggregate hours worked lifted by 0.2% in September to match August's outcome, though the annual pace eased from 2.0% to 1.9%. Average hours worked per employee ticked up by 0.1% in the month to 138.1 hours but was down by 0.5% on the level from a year earlier. 

For a full review of September's report see here


Market expectations Labour Force Survey 

According to Bloomberg's survey of economists, the consensus expectation is that employment increased by 
16.0k in October, with individual estimates varying between 7.0k and 30.0k. Meanwhile, the unemployment rate is anticipated to have remained at 5.2%, with the range of estimates tight between 5.2% and 5.3%. Lastly, no change in the participation rate from 66.1% is the consensus expectation between a range from 66.1% to 66.2%. 


What to watch Labour Force Survey

The key question is whether the unemployment rate, as well as the broader measures of underemployment and underutilisation, can hold on to (or potentially even improve on) their gains from the previous month in today's report. As is always the case, much will depend on what happens with the participation rate, with the decline in September from 66.2% to 66.1% coming against the run of play given this was its first monthly fall since February earlier this year. The outgoing rotation group in the ABS's sample has a lower participation rate than the sample as a whole, so there could potentially be some upside risk attached to the market's expectation for the participation rate to hold at 66.1%.      


Tuesday, November 12, 2019

Australian Q3 Wage Price Index; 0.5%q/q, 2.2%Y/Y

Australian wages growth matched expectations with a 0.5% rise in September quarter, as the annual pace eased from 2.3% to 2.2%. Wage outcomes remain weighed by a labour market with an elevated level of spare capacity, as well as other structural factors that have also impacted offshore economies, such as weakness in productivity growth. The Reserve Bank of Australia continues to emphasise that a tighter labour market is key to generating a faster pace of wages growth to lift inflation back to target. 

Wage Price Index — Q3 | By the numbers

  • The headline WPI (total hourly rates of pay ex-bonuses) increased by 0.53% in Q3 to match the consensus outcome (+0.5%), though Q2's initially reported increase of 0.61% was revised down to 0.53%. 
  • Annual growth in the WPI slowed, as expected, from an unrevised pace of 2.33% to 2.23%. 


Wage Price Index — Q3 | The details 

By way of background, the ABS's Wage Price Index (WPI) measures the change in price of wages and salaries paid by employers for a fixed group of jobs, unadjusted for compositional characteristics of employees (role responsibilities, experience, qualification levels, hours worked etc). As such, the WPI reflects underlying factors influencing wages growth, such as changes in individual and enterprise bargaining agreements and in minimum wage settings and awards. 

The headline WPI (excluding bonuses) increased by 0.53% over the 3 months to September, with the annual pace easing from 2.33% to 2.23%, as a 0.62% rise from Q3 2018 fell out of the 4-quarter calculation. The public sector drove this slowdown, with wages rising by 0.52% in Q3 compared to a 0.82% rise in the June quarter that was associated with a once-off recalibration for healthcare workers in Victoria. Thus, public sector wages growth in annual terms eased from 2.58% to 2.49%. In the private sector, the outcomes in the September quarter of 0.53% quarter-on-quarter and 2.25% year-on-year were essentially unchanged from Q2. 


Adjusting the headline WPI for inflation (as measured by the Consumer Price Index) implies that real wages growth softened slightly for the second straight quarter, but it remains positive overall.

   
The WPI inclusive of bonuses showed a strong rise of 1.28% in Q3, to lift the annual pace from 2.47% to 2.83%. The private sector drove this increase with a 1.44% acceleration in Q3, which boosted the annual pace from 2.41% to 3.0% — its strongest rate in nearly 7 years. In the public sector, wages including bonuses increased by a more moderate 0.74% for the quarter, as the annual pace slowed from 2.51% to 2.41%. 

     
On an industry-wide basis, there were 5 industries that recorded a faster pace of wages growth over the past year than the headline index, with those being; healthcare +3.23%, utilities +2.73%, transport +2.54%, professional services +2.5% and arts and recreation +2.45%. This is is down from a total of 8 industries that outperformed the WPI over the year to Q3 in 2018. The industries that saw the sharpest slowdown in wages growth over the past year were; education -0.59ppt, manufacturing -0.43ppt and wholesale trade -0.43ppt. The strongest increases from year to year came from; professional services +0.51ppt, healthcare +0.45ppt, and transport +0.26ppt. 


Across the states, Victoria led the way with a 2.8% year-on-year rise, while next best was the Australian Capital Territory at 2.5% followed by South Australia (2.3%) and Tasmania (2.3%). New South Wales and the Northern Territory were in line with the headline index at 2.2%, while Queensland (2.1%), Western Australia (1.6%) lagged behind. Private sector wages growth was strongest in Tasmania at 2.7%, while Victoria is well out in front for public sector wages growth at 2.9% and is indeed the strongest segment nationally. 


Wage Price Index — Q3 | Insights 

Today's report matched market and the RBA's expectations, with wages growth remaining well contained after easing to around a 2.2% annual pace. We also need to bear in mind that the quarterly outcome of 0.5% was boosted by the Fair Work Commission's recent decision to lift the minimum wage by 3.0% for the year, as well as by other recently approved Enterprise Bargaining Agreements in the retail industry. As has been widely discussed by the RBA, spare capacity in the labour market has been a key influence in holding back the pace of wages growth (see chart, below), though there have also been other headwinds from weak productivity growth and a more globally mobile workforce. The forecasts in the Bank's quarterly Statement on Monetary Policy that was released last week indicated that this spare capacity is expected to persist for at least the next couple of years, with wages growth also remaining subdued. The Board currently appears to be in wait-and-see mode after cutting the cash rate 3 times this year, but today's result underscores that further easing is likely in 2020, with a much tighter labour market required to lift wages growth and see inflation return to the 2-3% target band.

Preview: Wage Price Index — Q3

The ABS is scheduled to release the September quarter update of its Wage Price Index (WPI) at 11:30am (AEDT) today. The WPI measures the price change of wages and salaries paid by employers, excluding factors such as quantity and quality of work performed and other compositional characteristics. Wages growth has key implications for the Reserve Bank of Australia's outlook for household consumption growth and inflation and has, therefore, become an increasingly influential consideration within its policy decisions throughout 2019.      

As it stands Wage Price Index

Australian wages growth was slightly stronger than expected in Q2 rising by 0.6% in the quarter (expected was 0.5%), though the annual pace remained subdued and was unchanged at around 2.3%. 


The pace of wages growth is being restrained by an elevated level of spare capacity in the labour market. While employment growth was strong at around 2.5% over the year to September and clearly outpaced growth in the working-age population at around 1.7%, little progress was made in lowering the unemployment rate (currently 5.2%), while underemployment (8.3%) and underutilisation (13.5%) have also proved difficult to reduce given that the workforce participation rate has lifted sharply from where it was a year earlier. Weakness in productivity growth has also been a structural headwind.   

Growth in public sector wages spiked by 0.8% in the quarter, driven mostly by a once-off recalibration for healthcare workers in Victoria, which lifted the annual pace from 2.4% to 2.6%. In the private sector, wages growth was more modest lifting by 0.5% in the quarter and 2.3% through the year.


Wages growth inclusive of bonuses increased by 0.4% in Q2, with the annual pace slowing from 2.6% to 2.5%. Again, the public sector outperformed at 0.6% for the quarter and 2.5% year-on-year compared to a 0.4% quarterly rise and 2.4% annual pace in the private sector.

A full review of Q2's report is available here 

Market expectations Wage Price Index

Another subdued outcome is expected by markets in today's release. Bloomberg's median estimate is for the WPI to rise by 0.5% in Q3 (individual forecasts range between 0.4% and 0.7%), resulting in the annual pace easing from 2.3% to 2.2% (range: 2.1% to 2.4%).

What to watch Wage Price Index

Some upside risk is attached to the quarterly outcome for the headline WPI in today's release. Firstly, the 2019 decision from the Fair Work Commission (FWC) to raise the national minimum wage by 3.0% took effect from the start of the quarter and will thus provide a boost to wages growth in the quarter. According to the FWC, 21% of Australian employees are award-reliant, while there is also an additional portion of the workforce that have their pay linked to changes in the minimum wage in some way. Secondly, as last week's RBA Statement on Monetary Policy highlighted, some workers in the retail sector, which is the second-largest employer in Australia according to the ABS's estimates, have faced an enduring period of wage freezes while new Enterprise Bargaining Agreements (EBA) were either being negotiated or awaiting FWC approval. Over the past year, a number of new retail-related EBAs were approved and came into effect from the start of Q3, so this will also provide a boost to the quarterly figure. 


Saturday, November 9, 2019

Macro (Re)view (8/11) | RBA looking towards 2020

As widely anticipated, the Reserve Bank of Australia (RBA) kept the cash rate on hold at 0.75% at their Board meeting this week. The decision statement from Governor Philip Lowe indicated that having cut the cash rate by a total of 75 basis points since June, the Board is taking a wait-and-see approach, though it remains prepared to ease further if labour market conditions were to deteriorate, while developments offshore continue to remain a key focus (see our review here). The Bank's quarterly Statement on Monetary Policy released this week outlined that in spite of concerns around confidence, further easing in the cash rate is still likely to be effective citing the channels of exchange rate depreciation, higher asset prices and an income boost to households. However, in a sign of what may be ahead in 2020 it noted that: "...each further cut brings closer the point at which other policy options might come into play". 

Clearly, much depends on the outlook and on this front the Bank made only limited changes to its growth and inflation forecasts in this quarter's update. GDP growth in 2019 was lowered from 2.5% to 2.25%, but it is still expected to pick up to 2.75% in 2020 and then 3.0% in 2021. The key risk remains around the outlook for household consumption growth, which the RBA anticipates will slow to a 1.4% annual pace in 2019 before recovering over 2020 to 1.9% by mid year then rise to 2.4% by year's end. These risks were underscored by this week's disappointing retail sales report for September, with turnover lifting by just 0.2% in the month as volumes contracted by 0.1% in the quarter despite recent stimulus (see our review here). Spare capacity in the labour market is forecast to persist, with the unemployment rate forecasts unchanged and expected to remain around its current level of 5.25% until mid-2021 when it eases to 5.0%. As such, the inflation outlook remains low and steady, with headline CPI still seen at 1.75% in 2019 and 2020 before lifting to 2.0% at end 2021, while the key trimmed mean CPI is unchanged from 1.5% in 2019 and 1.75% in 2020, however the return to the lower band of the 2-3% target was pushed out from mid to end 2021. 

Also this week, housing finance approvals to owner-occupiers continued their upswing advancing by 3.6% in September, with annual growth turning positive for the first time in 18 months at 0.5% (reviewed here). The value of lending commitments firmed by 1.3% in the month and is now advancing in annual terms at 0.1% for the first time in nearly two years. As our chart of the week (below) shows, the turnaround has been rapid coming off a trough of -21.6% reached just 4 months earlier with the owner-occupier segment leading the way. Finally, the nation's trade surplus surged above expectations to $7.2bn in September as export earnings lifted by 3.5% in the month to outpace a 2.5% increase in imports (reviewed here). All in all, the trade surplus looks to have increased in the order of 8% over Q3 driven by a solid boost from export prices. 

Chart of the week

—    

Improving sentiment continued in offshore markets this week highlighted by the US 10-year yield advancing by 23 basis points to 1.94% to its highest since late July, while the US S&P500 equity index posted its 5th straight weekly gain. Key to this week's moves was rising optimism around US-China trade developments on media reports quoting a spokesman from China's Commerce Ministry indicating that both sides had agreed to a phased rollback of tariffs. However, those reports were dismissed late in the week by US President Trump saying that no such agreement had been reached and that a complete rollback of tariffs was not on the cards. As things stand, both the US and China are still working towards finalising the 'Phase One' deal, which appears likely to be delayed until December, while the location for the signing of the agreement also needs to be determined. While work remains to be done, relations have found a more constructive tone of late and this has supported risk sentiment in markets. Also helping this week was a 2.1% month-to-month rise in the ISM non-manufacturing index in October to a reading of 54.7, indicating that the expansion in the US' services sector is picking up and is resilient to the slowdown occurring in manufacturing. Of note, firms reported solid increases in employment, activity and new orders during October, though the trade-exposed components were soft. 

Over in Europe, the details from Markit's Purchasing Managers' Indexes (PMI) continued to confirm a contrast between the manufacturing and services sectors. October's PMI for the manufacturing sector was upgraded slightly from the flash reading of 45.7 to 45.9, but activity in the sector is at its weakest in 7 years. Meanwhile, the services PMI showed a faster rate of expansion occurred in October at 52.2 compared to the flash reading of 51.8. Overall, the composite PMI for the month was finalised at 50.6 from a flash reading of 50.2, indicating that the euro area economy almost stalled in October. In the UK, the Bank of England left its policy stance on hold at its meeting this week, though the vote went 7-2 (members Haskel and Saunders voted for a 25bps rate cut) whereas the Monetary Policy Committee had returned unanimous 9-0 'on hold' verdicts at every meeting since September last year. In the Bank's Monetary Policy Report GDP growth was forecast to come in at 1.0% in 2019 before rising to 1.6% in 2020, 1.8% in 2021 and 2.1% in 2022, though the MPC highlighted that the risks are "skewed to the downside" given the uncertainty over the nature of the UK's withdrawal from the EU.


Thursday, November 7, 2019

Upswing in Australian housing finance approvals continues in September

The upswing in Australian housing finance owner-occupier approvals continued at pace in September rising by a sharp 3.6% on the month. On aggregate, the value of lending commitments is now expanding in annual terms for the first time in nearly 2 years. Today's report was further confirmation of the notable shift in sentiment that has occurred since mid year. 

Housing Finance — September | By the numbers

  • Housing finance approvals to owner-occupiers (excluding refinancing) surged by 3.6% in September to 34,410, whereas markets had only anticipated a rise of 1.0% (prior rev 1.9% from +0.7%). In annual terms, growth swung from -4.6% to +0.5% to be in positive territory for the first time since January 2018.
  • The total value of housing finance commitments (excluding refinancing) posted a 1.3% rise in the month to $A18.93bn (prior rev +4.2% from +2.9%) with annual growth improving from -4.3% to +0.1%, turning positive for the first time since November 2017.  


Housing Finance — September | The details 

The 1.3% rise in the value of lending commitments in September was driven by the owner-occupier segment, which lifted by 3.2% to $14.24bn (excluding refinancing), while the investor segment saw a 4% contraction in the month to $4.69bn.


Activity in both segments hit a turning point over Q3, with commitments up by 10.6% to owner-occupiers and 7.4% to investors. For owner-occupiers, this was the strongest quarter since Q3 2015, while investor commitments on a quarterly basis expanded at their fastest going back to Q4 2016. The last occasion where both segments posted quarterly gains was Q1 2017. 

  
In annual terms, growth in total lending commitments is in positive territory, albeit only just at +0.1%, for the first time since November 2017. This is quite a remarkable turnaround given the most recent trough of -21.6% was reached just 4 months ago. Leading the way has been the owner-occupier segment, which is now running at a 5.6% annual pace — its fastest since February 2018 — from a trough of -18.8% over the year to May 2019. The investor segment is still heavily negative at -13.6% but is well off the trough of around -30% in mid-2019. 


The pick-up in owner-occupier activity has been broad-based across the states, with approvals up in September and over the quarter: New South Wales +1.5%m/m (+8.0%q/q), Victoria +2.4%m/m (+6.0%q/q), Queensland +3.3%m/m (+7.6%q/q), South Australia +0.7%m/m (+4.0%q/q), Western Australia +6.1%m/m (+6.4%q/q) and Tasmania +8.7%m/m (+4.7%q/q). 


As the next charts show, approvals to both 'upgraders' and first home buyers are generally on the rise across each of the states.


The complete summation of state-based details in September is provided in the table, below. 


Housing Finance — September | Insights

Today's update was much stronger than anticipated with housing finance approvals continuing to gather momentum towards the end of the year. Owner-occupiers are predominantly driving the turnaround, though the investor segment appears to be moving off its lows from mid year. Key is that sentiment has improved sharply since May's federal election, the recommencement of the RBA's easing cycle and a softening in APRA's guidance around credit assessment criteria. 

Wednesday, November 6, 2019

Australia's trade surplus rises to $7.2bn in September

After easing in the previous two months, Australia's trade surplus accelerated against expectations to $7.2bn in September. The trade surplus for the September quarter reached a new record level of $20.9bn to eclipse the previous high set in Q2.   

International Trade — September | By the numbers
  • September's trade surplus came in at $A7.18bn and well clear of the market forecast of $5.05bn. August's initially reported surplus of $5.926bn was revised up to $6.617bn in today's release. 
  • Export earnings increased by 3.5% in September to $43.215bn to more than offset a 2.0% fall in the previous month, while the annual pace firmed from 12.0% to 14.8%. 
  • Import expenditure lifted by 2.5% in the month to $36.034bn (prior rev -0.5%m/m) driving the annual pace from -0.4% to 3.2%.

  • The sum of the nation's monthly trade surpluses reached $21.113bn over Q3 (July $7.316bn, August $6.617bn and September $7.18bn), with the ABS reporting its preliminary estimate for the quarter is $20.917bn, after seasonal adjustments. This implies the trade surplus lifted by $1.599bn or 8.3% over Q3. 

International Trade — September | The details 

Export earnings were up by 3.5% (or $1.452bn) in September to $43.215bn. The gains were broad-based across non-rural goods 2.1% ($586m), non-monetary gold 26.1% ($558m), rural goods 6.4% ($240m) and services 0.8% ($69m). For non-rural goods, the gains were led by 'other mineral fuels' (which includes LNG) rising by 8% ($417m) and metal ores and minerals (including iron ore) up by 3% ($318m). In rural goods, increases from cereals (18%) and meat (2%) is likely an indication of drought-related impacts on prices. In year-on-year terms, export earnings have risen by a sharp 14.8% with strength in iron ore prices the key.   


Expenditure on imports increased by 2.5% (or $889m) over September to come in at a total of $36.034bn. Most of the sub-categories increased over the month; capital goods 11.6% ($702m), intermediate goods 4.5% ($474m), consumption goods 0.7% ($64m) and services 0.3% ($22m), though non-monetary gold declined by 34% (-$373m). Within intermediate goods, fuels and lubricants increased by 8% ($238m) on rising oil prices. Through the year, imports are up by 3.2%, which is partially driven by a weaker Australian dollar. 

         
International Trade — September | Insights

The trade surplus was up by a robust 8% (or $1.6bn) over Q3. Export earnings lifted by around 2.7% on Q2, while imports increased by a more modest 0.8%. Data out last week indicated that export prices increased by 1.3% in Q3 and import prices were little changed rising by only 0.4%. In the June quarter, net exports contributed a solid 0.6ppt to GDP growth, but it will likely slow to around half of that in Q3, based on current indications. Meanwhile, the terms of trade look likely to post another solid increase in Q3 boosting national income.  

Tuesday, November 5, 2019

RBA on hold in November

The Reserve Bank of Australia Board left the cash rate on hold at 0.75% on Tuesday, as expected. Leading into this meeting, market pricing had been lowered to indicate only around a 5% chance of a November rate cut, while all 25 economists surveyed by Bloomberg Australia had forecast no change in policy settings. 


Developments from offshore have been in key in the Board's recent thinking and this was the early focus of the decision statement from Governor Philip Lowe. Risks to the global economic outlook are still described as "tilted to the downside", though it was acknowledged that since the Board last met "expectations of further monetary easing have generally been scaled back" and also that "financial market sentiment has improved a little". Though not stated, the key developments here have been an easing in geopolitical risks with more optimism coming over the US-China trade situation and diminished risk of a no-deal Brexit, while fears of a US recession have also calmed somewhat.

Domestically, ahead of Friday's quarterly statement and updated forecasts, the governor outlined that GDP growth in 2019 is now seen at 2.25% compared to the 2.5% pace anticipated 3 months ago, though it appears that it will retain its forecast for growth of 2.75% in 2020 given that output is still expected to expand by 3.0% in 2021. The factors mentioned as supporting this assessment were stimulus from interest rate cuts, tax relief, infrastructure investment, rising house prices, and a more buoyant resources sector. Key risks identified are around the outlook for household consumption growth as well as the housing construction cycle, which is yet to reach its trough, and drought-related impacts.

The key to the Board's reaction function presently is around developments in the labour market. Overall, it continues to view an economy that is operating with spare capacity, with the underlying dynamic being that strong employment growth is being met with rising participation. As such, the unemployment rate is expected to remain around its present level of 5.25% "for some time, before gradually declining to a little below 5 per cent in 2021". The governor also noted that faster wages growth "is needed for inflation to be sustainably within the 2-3 per cent target range". On inflation, the outlook is little changed, though the forecast for 2020 has risen from 1.75% to 2.0%, but is maintained at 2.0% for 2021. 

In his concluding remarks, the governor maintained his recent practice of describing monetary policy in terms of its impact on employment and incomes. Governor Lowe's assessment was that "the easing of monetary policy since June is supporting employment and income growth in Australia and a return of inflation to the medium-term target". With only one meeting left in 2019, it appears unlikely there will be enough evidence accumulate over the next few weeks to shift that view. All considered, the Board appears in no rush to ease again in 2019 but it still retains its easing bias, which it is prepared to act on if its labour market outlook is deemed at risk.

Monday, November 4, 2019

Preview: RBA November meeting

The Reserve Bank of Australia (RBA) Board meets in Sydney today for its latest policy meeting, with the decision to be announced by Governor Philip Lowe at 2:30PM AEDT. Expectations are the cash rate will be left on hold at 0.75%.


At the Board's previous meeting on October 1, the decision was taken to lower the cash rate by 25 basis points for the third time 2019 following the cuts delivered in June and July. The minutes from that meeting outlined that: "Members judged that lower interest rates would help reduce spare capacity in the economy by supporting employment and income growth and providing greater confidence that inflation would be consistent with the medium-term target". Employment and incomes are clearly key for the RBA as Governor Lowe discussed in a speech last week, while he also emphasised the flexibility the Board has in meeting its inflation target.   

In the intervening period since October's meeting, the main developments have been:


  • From offshore: After a turbulent month in September, sentiment in global markets was more optimistic in October. Key to this was signs of progress in US-China trade negotiations leading to the tentative 'phase one' agreement, while in the UK the risk of a no-deal Brexit appears to have subsided with PM Johnson securing a new withdrawal agreement with EU and will now take this to an early general election on December 12. Overall, global activity surveys indicated that weakness persists in the manufacturing sector and while there are signs this is spilling over to the services sector, it remains resilient on the whole. As such, the IMF issued another downgrade to its global GDP growth forecasts in 2019 (from 3.3% to 3.0%) and in 2020 (from 3.6% to 3.4%). Data for Q3 showed that GDP growth slowed in the US (2.0% to 1.9% annualised), China (6.2% to 6.0%Y/Y) and the euro area (1.2% to 1.1%Y/Y). On the policy front, the US FOMC announced its 3rd consecutive 25 basis point rate cut taking the fed funds target range to 1.5-1.75%, while in Europe the ECB left its policy stance on hold and in Japan the BoJ was also unchanged but tweaked its forward guidance to indicate that lower rates may be on the cards.  

  • In Australia: The headline developments were in the labour market and inflation. In September, employment increased in line with expectations rising by a net 14.7k and 87.6k over Q3 (see here). Employment growth continues to defy expectations for a slowdown holding at 2.5% in annual terms, while the 3-month annualised pace lifted from 2.3% to 2.7%, implying the pace has reaccelerated recently. With the participation rate ticking down by 0.1ppt to 66.1%, the unemployment rate reversed its increase in the previous month falling from 5.3% to 5.2%. Furthermore, the underemployment rate fell from 8.5% to 8.3% and the underutilisation rate declined from 13.8% to 13.5%. In Q3, inflation matched market and RBA expectations on both a headline and underlying basis but remains soft overall (see here). Headline inflation came in at 0.5% in the quarter and the annual pace lifted slightly from 1.6% to 1.7%. The RBA's preferred trimmed mean measure printed at 0.4% in Q3 keeping the annual pace at 1.6% and well below the 2-3% target band. Also of note, consumer confidence according to the Westpac Melbourne Institute's index saw a precipitous decline of 5.5% in the month and highlighted concerns around the economic outlook, with consumers now at their most pessimistic since mid-2015. However, the turnaround in the housing market continues to gather momentum as finance approvals to the owner-occupier segment lifted by 0.7% in August to mark a 4th consecutive monthly rise (see here), while capital city house prices increased by 1.4% in October according to CoreLogic following gains of 1.1% in September and 1.0% in August. 

All considered, with a slight more constructive tone from offshore and with the improvements seen in the most recent labour market data, the Board is highly likely to remain on hold at 0.75%. Inflation remains below target but the explanation used to justify the previous rate cuts as well Governor Lowe's comments around the inflation target in his speech last week reiterates the point that the reaction function is currently more about labour market developments. Markets are pricing in only a 7% chance of a rate cut today, while all 25 economists surveyed by Bloomberg Australia expect no change in the cash rate. 

Sunday, November 3, 2019

Australian retail sales in September +0.2%; Q3 volumes -0.1%

Australian retail spending disappointed expectations in September with little sign that recent stimulus measures have gained traction with consumers, indicating that weak confidence could be weighing. Over the September quarter, real retail sales contracted by 0.1% in a much weak-than-expected result. 

Retail Sales — September | By the numbers
  • Retail turnover increased by 0.2% in September to $A27.59bn to disappoint the market median forecast of 0.4% (prior: 0.4%). 
  • Turnover growth in annual terms was unchanged at 2.5% after allowing for a downward revision from 2.6% in the previous month. In trend terms, turnover lifted by 0.2% in September and 2.4% over the year.   

  • Retail volumes (nominal spending adjusted for price changes) fell by 0.1% in Q3, which was well below the 0.3% gain expected by markets and reversed a 0.1% increase in Q2.  
  • Annual volume growth swung from +0.2% to -0.2% and is at its weakest pace in 28 years.   


Retail Sales — September | The details

Retail spending in nominal terms lifted by 0.2% in September to $27.59bn (+2.5%Y/Y), with gains coming from food (+0.1%), 'other' (+0.8%) and cafes and restaurants (+0.6%). Categories that declined in the month were; clothing and footwear (-0.5%) and department stores (-0.2%), while household goods were flat. Sales ex-food lifted by 0.2% in September and 2.1% for the year. In Q3, turnover increased by 0.6% with the details being; food +0.6%, household goods +0.8%, clothing and footwear +1.4%, department stores +0.1%, other +0.7% and cafes and restaurants -0.3%. Excluding food, turnover lifted by 0.5% in Q3.   


Retail prices increased by 0.6% in the September quarter and was slightly above the 0.5% rise in Q2. Referencing the pass-through impact from a weaker Australian dollar, clothing and footwear prices lifted by 1.1% in Q3 to outpace rises from food (+0.7%), department stores (+0.2%), other (+0.4%) and cafes and restaurants (+0.8%). The main influence on prices over the past year has been from food, likely due to drought-related impacts.  


Adjusting nominal sales for these price changes, total volumes fell by 0.1% over the quarter. The details were; food 0.0%, household goods +0.9%, clothing and footwear +0.3%, department stores -0.1%, other +0.3% and cafes and restaurants -1.0%. Volumes ex-food were down by 0.1% in Q3 highlighting weakness in discretionary-related demand.  


The 4-quarter profile for retail volumes is; -0.1% (Q4 2018), -0.1% (Q1 2019), +0.1% (Q2 2019) and -0.1% (Q3 2019). As a result, the annual pace has fallen to -0.2% — its weakest since Q2 1991. Weighing on this has been price increases over the past 4 quarters of 0.8% (Q4 2018), 0.7% (Q1 2019), 0.5% (Q2 2019) and 0.6% (Q3 2019).   


Retail spending was soft across the major states of New South Wales and Victoria in September, which combined account for nearly 60% of national turnover. For the month, New South Wales posted a modest 0.3% rise as spending stalled in Victoria. In Q3, spending lagged the national increase (0.6%) for both states; New South Wales +0.4% and Victoria +0.5%. Over the past year, turnover in Victoria at 2.6% has run at twice the pace of that in New South Wales at 1.3% and is also slightly above the national pace (+2.5%). 


The details for the remaining states in September were generally positive; Queensland -0.1%, South Australia +0.2%, Western Australia +0.7% and Tasmania +1.0%. Standouts in Q3 were Western Australia (+1.6%) and Tasmania (+1.3%), with both Queensland (+0.4%) and South Australia (0.0%) soft. In annual terms, Queensland is leading the nation* (+4.2%) followed by Western Australia (+3.5%), while Tasmania is in line with the national pace but is notably weaker in South Australia (+1.7%). *Note ACT is running at a 4.3% annual pace but only accounts for a little under 2% of national turnover compared to 20% for Queensland. 


Retail Sales — September | Insights

This was a weak and disappointing update on retail sales with few indications that recent stimulus from RBA rate cuts and federal government tax relief have gained traction with consumers. One possible explanation is that with consumer sentiment according to Westpac Melbourne Institute's Index having weakened sharply since mid-year to currently sit well in pessimistic territory, consumers are looking to save more of this cash flow benefit. Overall, weak wages growth remains a strong headwind for retail sales and indications are that household consumption growth will slow further in Q3's National Accounts.