Independent Australian and global macro analysis

Wednesday, October 30, 2019

Australian dwelling approvals rise by 7.6% in September

Australian dwelling approvals lifted by a much sharper-than-expected 7.6% in September, though Q3's aggregate was the lowest quarterly outturn in more than 7 years. Indications are that weakness in residential construction activity will remain a drag on output growth for some time yet. 

Building Approvals — September | By the numbers
  • Total dwelling approvals (including both the private and public sectors) increased by 7.6% in September to 14,004 against expectations for a flat outcome. August's initially reported decline of -1.1% was revised to -0.6%. 
  • The year-on-year decline in dwelling approvals eased from -21.1% (revised from -21.5%) to -19.0%. 
  • Unit approvals surged by 16.1% in the month to 5,500 to be down by -27.8% through the year  (prior rev: +1.8%m/m, -28.5%Y/Y).
  • House approvals lifted by 2.7% in September to 8,504 for an annual fall of -12.0% (prior rev: -2.0%m/m, -16.1%Y/Y).

Building Approvals — September | The details 

In the 3 months to September, the aggregate of dwelling approvals was 40,121 — its lowest quarterly total since Q2 2012 — representing a decline of 7.4% on Q2's total of 43,340. The 4-quarter profile for dwelling approvals is -11.1% in Q4 (2018), +1.8% in Q1, -7.8% in Q2 and -7.4% in Q3. For the September quarter, the weakness was predominantly in units (-14.9% to 14,892), though house approvals also declined (-2.4% to 25,230).   


As a result of the ongoing declines in approvals, the outlook for residential construction activity is very weak and is therefore likely to remain a drag on output growth well into next year. 


Looking across the states, approvals were volatile in September; New South Wales -2.5% (-27.2%Y/Y), Victoria +3.3% (-27.6%Y/Y), Queensland +19.6% (-12.0%Y/Y), South Australia +16.0% (-9.0%Y/Y), Western Australia -24.5% (-19.3%Y/Y) and Tasmania +3.4% (+6.6%Y/Y).

Over Q3, the weakness continued to be driven by New South Wales (-14.8%) and Victoria (-9.1%). There were more moderate declines in Queensland (-2.2%) and Western Australia (-3.5%), while South Australia (+10.2%) and Tasmania (+11.0%) posted increases. 

  
The value of alteration work approved to existing residential properties posted a 2.8% rise in September to $708.8m to be up by 3.0% on a year earlier. Non-residential work approved slumped by 36.6% in the month to $3.95bn and partially reversed a 58.8% rise in August, but it remains in a strong uptrend at +14.0%Y/Y. 


Building Approvals — September | Insights

September's 7.6% increase in dwelling approvals ended a run of 3 consecutive monthly declines, though it was driven mostly by the volatile unit segment. Nevertheless, the 2.7% increase in house approvals was its strongest monthly gain since June 2018. While the downtrend for units remains in place, house approvals may be starting to level out. Overall, the takeaway is that further weakness in residential construction activity appears likely to continue until well into 2020. 

Tuesday, October 29, 2019

Australia Q3 CPI 0.5%q/q, 1.7%Y/Y; trimmed mean 0.4%q/q, 1.6%Y/Y

Australia's headline Consumer Price Index (CPI) increased in line with market expectations in the September quarter rising by 0.5% to be 1.7% higher through the year. The Reserve Bank of Australia's preferred measure was little changed at 0.4% in the quarter and 1.6% year-on-year and remains well below its 2-3% target band. The Bank's current forecasts do not anticipate a return to the lower bound until mid-2021.   

Consumer Price Index — Q3 | By the numbers 
  • Headline CPI increased by 0.52% in Q1 to be in line with the median forecast (prior 0.61%), while the annual pace lifted from 1.59% to 1.67%, as expected.


  • Underlying inflation, based on the average of the trimmed mean and weighted median measures, increased by 0.36% in Q3 (expected: 0.4%, prior 0.41%), with the annual pace little changed at 1.40% from 1.42% (expected 1.4%). 
  • Trimmed mean inflation, the RBA's preferred measure, lifted by 0.38% in the September quarter (expected: 0.4%, prior revised: 0.44%), which kept the year-on-year pace unchanged at 1.55% (expected: 1.6%). 
  • Weighted median inflation lifted by 0.33% in Q3 (expected: 0.4%, prior 0.37%), with the annual pace softening slightly from 1.29% to 1.24% (expected: 1.3%). 


Consumer Price Index — Q3 | The details 

The 0.52% increase in headline CPI in the September quarter was led by the recreation and culture group (+0.23ppt), which mostly reflected a strong increase from international holiday travel and accommodation (+0.22ppt) coinciding with the peak tourist seasons in the US and Europe.

The next highest contribution came from alcohol and tobacco (+0.18ppt), with tobacco accounting for the bulk of this (+0.12ppt), with the ABS reporting that this incorporates the impact of a 12.5% rise in the federal excise tax applicable from the start of September.

Furnishings, household equipment and services contributed 0.11ppt to headline CPI, with domestic household services adding 0.05ppt on the back of a rise in childcare fees (+0.04ppt). Meanwhile, furniture and furnishings contributed 0.04ppt after a 0.02ppt addition in the previous quarter. Together with a 0.05ppt contribution from clothing and footwear (+0.06ppt in Q2), this continues to point to an upward impact on prices from the pass-through of a weaker Australian dollar.

In the housing group (+0.09ppt), weakness remains in rents (0.0ppt), while new dwelling costs fell for the third consecutive quarter (-0.01ppt) with developers maintaining purchase incentives. Household utilities added 0.04ppt, with water +0.03ppt and electricity -0.02ppt. Electricity costs fell for the third straight quarter due to changes in pricing arrangement in the eastern states. Meanwhile, property rates and charges added 0.04ppt. 

Food and non-alcoholic beverages made a 0.07ppt contribution to the headline CPI figure, with increases from bread (+0.02ppt), lamb (+0.01ppt) and beef (+0.01ppt) pointing to drought-related impacts. At the same time, fruit and vegetables subtracted -0.04ppt, with the ABS reporting increased yields from berries, citrus fruits, tomatoes and broccoli placed downward pressure on prices.     

A modest contribution came from insurance and financial services (+0.02ppt), while education was flat in Q3. 

Subtracting from inflation in Q3 were; health (-0.01ppt) due to more consumers receiving the benefits from the PBS, transport (-0.03ppt) as automotive fuel prices weakened (-0.07ppt) after a sharp increase in Q2, and communication (-0.03ppt) reflecting cheaper telecommunication equipment and services.    

 
In percentage terms, the chart, below, displays the price changes across the groups in Q3 and over the past year. 


In a broader context, domestic inflation continues to be driven by non-tradables (goods and services where prices are determined by on-shore factors) at 1.92% compared to 1.17% for tradables (items where prices are influenced by global factors). However, taking a more near-term view, tradables at 1.18% clearly outpaced non-tradables at 0.25% Q2 and a similar theme occurred in Q3 at 0.87% for tradables and 0.41% for non-tradables. Overall, this is indicative of pass-through to prices due to Australian dollar weakness. 

   
Consumer Price Index — Q3 | Insights

Today's report was in line with market expectations and was also consistent with the RBA's year-ended forecasts for both headline and trimmed mean inflation. Prior to these data, markets had assessed the chance of a rate cut at next week's November meeting at around a 20% chance but that has now been significantly scaled back and is in single figures. Overall, there was little new information in today's report. Inflation remains well below the RBA's target band (see chart, below) and is constrained by a labour market with considerable spare capacity, weakness in rents and new dwelling costs and also by the impact of government policy that has been directed at lowering electricity prices. Rising retail prices due to a weaker Australian dollar is an emerging theme, but the impact so far is fairly modest. Drought-related impacts are continuing to place pressure on some food costs. Soft inflation in Australia is also consistent with the trend in other major economies and is likely influenced by structural changes associated with globalisation from increased competition and technological advancements. 


Preview: CPI — September quarter

Australia's September quarter inflation data are due to be released by the ABS today at 11:30am (AEDT). As measured by the Consumer Price Index (CPI), Australia's inflationary pulse has been soft over recent years mirroring the trend experienced in other major economies as the forces of globalisation from increased competition and technological advancements have weighed on price pressures. Domestic influences have also been key highlighted by spare capacity in the labour market and below-trend output growth. 

The triple mandate of the Reserve Bank of Australia (RBA) includes an inflation target of 2-3% but the last time this objective was achieved was in the December quarter of 2015. The Board resumed its easing cycle earlier this year and since June has cut the cash rate by a total of 75 basis points to 0.75% to reduce spare capacity in the labour market by strengthening the pace of employment growth, lift wages growth and, in turn, generate inflation pressures. Notwithstanding, the progress back to target is expected to be gradual with the Bank's current forecats not indicating a return to the lower 2% band until mid-2021.    


As it stands CPI 

The headline CPI measure (based on price changes in a fixed basket of goods and services) increased above expectations in the June quarter at 0.61% (forecast 0.5%), driven mostly by a strong increase in petrol prices, while there were also some signs of pass-through from a weaker Australian dollar with modest rises in the clothing and footwear and household goods groups. The annual pace lifted from 1.33% to 1.59% and outpaced the median forecast of 1.5%.


The average of the underlying CPI measures (adjusted for extreme price changes) came in at 0.4% in Q2, while the annual pace eased from 1.53% to 1.46%. Breaking this down, the trimmed mean measure  the RBA's preferred index — firmed from 0.3% to 0.42% to meet the consensus figure in Q2, while the annual pace was unchanged at 1.62%, also as expected. The weighted median measure lifted from 0.15% to 0.37% in the quarter, though the annual pace eased from 1.44% to 1.31% (after incorporating a later revision). 


The outcomes for headline inflation (1.59%Y/Y) and the trimmed mean (1.62%Y/Y) were in line with the forecasts in the RBA's August Statement on Monetary Policy.   

For our full review of Q2's CPI report see here


Market Expectations CPI 

Today's release is expected to see inflation remain broadly unchanged. According to Bloomberg's survey of economists, the median forecast for headline CPI is 0.5% in Q3 (range: 0.3% to 0.9%), while the year-on-year pace is anticipated to lift to 1.7% (range: 1.4% to 1.8%). Core inflation is expected to remain around 0.4% in the quarter and 1.45% in annual terms. The median forecast for the trimmed mean is 0.4% in Q3, though the range is quite wide at 0.2% to 0.9%, with the annual pace to hold at 1.6% (range: 1.2% to 1.7%). Finally, the weighted median is forecast to remain unchanged at 0.4% quarter-on-quarter and 1.3% year-on-year.  


What to watch CPI

With inflation meeting the RBA's expectations in the June quarter and expected to remain broadly unchanged in Q3, financial markets assess the risk of a rate cut at next week's Board meeting as low with pricing indicating around a 20% chance. This also reflects a decline in the national unemployment rate to 5.2% in September in the most recent data (see here). As such, a further cut in the cash rate by 25 basis points to 0.5% is now not fully discounted until around mid next year. 

The underlying detail, therefore, appears to be of most interest today. On this front, Q2's report contained indications that the pass-through to prices from a weaker Australian dollar (around -5% in USD terms over the year to Q2) was starting to gain some traction. This can be seen in tradables inflation (excluding volatile items) rising by 0.5% in Q2 and 1.0% over the year — its fastest annual pace in 5 years — shown in the chart, below. This theme likely has further to run given Australian dollar weakness persisted over Q3 (-3.8% in USD terms) as the RBA cut rates in July and indicated a willingness to ease further, which it subsequently acted on in October. In addition, the impact of drought conditions is likely to have resulted in further price increases for meat and bread in Q3. 

Friday, October 25, 2019

Macro (Re)view (25/10) | ECB on hold in Draghi's farewell

At this week's European Central Bank (ECB) meeting, the Governing Council left its policy stance unchanged, as expected. At the previous meeting in September, President Mario Draghi announced a broad-based package of stimulus measures, which included an adjustment in forward guidance to a state-based rather than calendar-based dependence, a deepening of negative interest rates, restarting quantitive easing on an open-ended basis, lowering the pricing and extending the duration of TLTRO III (loans to banks) and introducing a tiering system to mitigate some of the charge on banks' excess reserves held at the ECB due to negative interest rates.

The account of the September meeting released two weeks ago showed that had been a considerable divergence of views within the Governing Council around the proportionality of this response to the prevailing conditions. This was largely the focus of the 
post-meeting press conference, with President Draghi explaining that while disagreements are "part and parcel" in policy decisions the actions taken were necessary to bolster its accommodative stance as it had "been affected by the regularly, continuously weakening medium-term outlook". Furthermore, the data received since that meeting had shown that the "Governing Council's determination to act in a substantive manner was justified". Released just before Thursday's meeting, Markit's Purchasing Managers' Index (PMI) for October showed manufacturing activity stabilising at a weak level of 45.7 against a still-resilient services sector at 51.8 (readings > 50 signal expansion). Looking ahead, the risks to the growth outlook in the euro area "remain on the downside" impacted by the ongoing uncertainties posed by "geopolitical factors, rising protectionism, and vulnerabilities in emerging markets". As such, President Draghi reiterated his call for governments, where they had the appropriate space, to step-up fiscal stimulus. This was a point he later reinforced in response to a question regarding the potential problem of the ECB running up against their self-imposed limits on bond purchases. Basically, this was not likely to materialise if countries that had the capacity to do so increased bond issuance to facilitate fiscal stimulus.

As this was President Draghi's final meeting of his notable 8-year tenure at the helm of the Governing Council it is worth reflecting on. A transformative and innovative central banker, Draghi was influential in the preservation of the euro as the bloc's single-use currency during the early years of his tenure which coincided with the sovereign debt crisis. Fiscal imprudence and structural weakness inherent in member states' economies sparked concerns of widespread sovereign defaults and this, in turn, severely impacted the banking and financial system. Draghi's mid-2012 speech in London was the moment when things began to turn due to his now-famous pledge: "Within our mandate, the ECB is ready to do whatever it takes to preserve the euro. And believe me, it will be enough". Fast forward to late 2019; the euro still exists, a deflationary spiral was avoided, the unemployment rate has returned to pre-crisis levels (shown as chart of the week, below) and public support for the euro is at a record high.


Chart of the week


To get there, Draghi led the way into a new frontier as he called on an ever-expanding toolbox of unconventional monetary policy measures. As September's meeting highlighted, these decisions were often met with stern opposition from the Governing Council's hawks. There may have been a political price but ultimately as he discussed in a recent speech, there was no alternative: "Accepting failure is not an option when there are tools available for public servants to fulfill their mandates". Detractors will point to Draghi's inflation record that failed to meet this mandate as evidence of a flawed policy regime, but the counterfactual could have been considerably worse. As he said during Thursday's press conference, the message was simple: "never give up". A precise and assured communicator, markets will surely miss Draghi's innate ability to assuage even the most skittish sentiment during his public appearances. A great legacy indeed.  

In the UK, Brexit developments during the week saw the Parliament support an in-principal vote for PM Johnson's withdrawal deal but reject the timeframe to fast track the proposal. As such, the 31 October deadline will pass by, however the EU confirmed on Friday it had accepted the UK's request for an extension, though it postponed a decision on the new withdrawal date until next week. In the interim, PM Johnson will push for an early election to take place on December 12. 

Moving over to the US, Markit's Manufacturing PMI pointed to signs of stabilisation in the sector, with October's reading coming in above expectations at 51.5 from 51.1 in the previous month. Supporting the result were gains in output, new orders and employment. Some caution is probably warranted, though, given the more closely-followed ISM manufacturing survey showed a sharp contraction in September and October's update is due next week. The Services PMI firmed slightly from 50.9 to 51.0, indicating that business activity lifted to its strongest level in 3 months. However, the employment sub-index declined for the second straight month and this points to a more rapid slowdown in the hard data ahead of October's non-farm payrolls report that is out next Friday. Also notable was that durable goods orders data disappointed to the downside in September. Headline orders slumped by 1.1% in the month and the less volatile 'core' orders declined by 0.5% suggesting that business investment remains weak in the face of headwinds from trade tensions and a slowing global economy. Overall, the Composite PMI showed a marginal improvement from 51.0 to 51.2, but this implies US GDP growth was tracking at a below-trend annualised pace of around 1.5% at the start of Q4. The 1st estimate of Q3 GDP growth is due out next Wednesday and is expected to slow from 2.0% to 1.5%. Undoubtedly, the key event in the US next week is the Federal Reserve's policy meeting (29th & 30th) where the Committee is likely to deliver another 25 basis point rate cut to take the range of the fed funds rate to 1.5% to 1.75%.  

Lastly, in a very light week for events and data in Australia, CBA's 'flash' Composite PMI showed that business conditions softened in October but remained slightly expansionary at a reading of 50.7 from 52.0 in September. Conditions in the services sector slowed from 52.4 to 50.8 reflecting softness from new orders, employment and confidence. Meanwhile, the reading for the manufacturing sector stabilised at 50.1 from 50.3 in September but weakness was evident in new orders, with firms cutting back on purchases and inventories in response to soft demand.


Friday, October 18, 2019

Macro (Re)view (18/10) | Brexit deal reached; global risks remain

Following the tentative US-China 'phase 1' trade deal achieved last Friday, there was significant progress made this week in Brexit negotiations, with the UK and European Union reaching a withdrawal agreement. However, highlighting that the outlook for the global economy remains fragile, the IMF issued another downgrade to its growth outlook in 2019 and 2020. Its forecast for global GDP growth in 2019 was lowered from 3.3% to a post-financial crisis low 3.0%, while 2020's forecast was trimmed from 3.6% to 3.4%. These downgrades reflect the strain from trade and geopolitical tensions, which have had an acute impact on activity in the manufacturing sector globally prompting firms to defer or cut back investment plans, as well as structural headwinds from low productivity growth and aging populations. 

After a busy week of negotiations, a Brexit deal was reached between UK PM Johnson and the EU and will likely mean that a disorderly withdrawal process will be avoided. The stumbling block in the UK's withdrawal from the EU has largely related to the contentious Irish backstop solution that was negotiated by former PM May. Under this new deal of hybrid arrangements, the UK will exit the European customs zone but Northern Ireland will remain as an entry point into the EU. In practice, this means that goods coming into Northern Ireland will face UK-levied tariffs. However, if those goods are deemed at risk of later crossing over the border into Ireland (or anywhere else in the European customs zone), then EU tariffs will apply. This process will be administered by the UK authorities on behalf of the EU. The deal now heads to the House of Commons where the parliament will convene for a special Saturday sitting from 9:30am London time. The vote looks as if it will be finely balanced, with the DUP party to vote against the deal, which means that PM Johnson will require the support of some Labor or other opposition MPs, though it is not certain all of his Conservative MPs will vote for it in any case. If the vote fails, the PM will be forced against his insistence to seek an extension to the October 31 withdrawal date. (Saturday's vote was ultimately thwarted after an amendment was tabled by former Conservative MP Oliver Letwin and was approved 322 to 306, resulting in the PM writing to the EU to request an extension to the withdrawal date to January 31, 2020).         

In China, GDP growth in Q3 was in line with estimates at 1.5%, though the annual pace at 6.0% was a touch below the 6.1% pace expected and is on the lower bound of the 6.0-6.5% range targeted by authorities in Beijing. Trade data released earlier in the week highlighted the impact of tariffs, with exports contracting by a sharper-than-expected 3.2% over the year to September. Aside from external weakness, momentum in China's economy has been slowing due to a deceleration in investment over recent years, which in part reflects the impact of structural reforms that have sought to reduce overcapacity by industry and lower corporate debt levels. There were, however, upside surprises from growth in industrial output at 5.8%Y/Y and retail sales at 7.8%Y/Y. Recent actions from fiscal and monetary authorities have been focused on tax cuts, infrastructure investment, and reductions to banks' reserve ratios to effectively spur lending, though more stimulus appears to be required and what form it may take is unclear.

Developments from the US this week were headlined by a soft outturn from retail sales, which fell by 0.3% in September against an expected rise of 0.3%. The retail control group (used as a gauge for total consumer spending) also disappointed expectations with a flat outcome in the month. With a robust consumer sector remaining key to the US growth outlook, market pricing firmed to be factoring in an 80% chance the Federal Reserve's policy-setting Committee will maintain its proactive stance by delivering another 'insurance' rate cut at the end of the month. This was a view that found support with Chicago Federal Reserve President and Committee member Charles Evans, who in a speech this week outlined he could also see "an argument for more accommodation now" to guard against the risks attending the economic outlook, despite noting that monetary policy is "probably in a good place right now". Federal Reserve Vice Chair Richard Clarida in a speech noted the risks to the Committee's economic outlook were around weakness in business investment and exports and a contracting manufacturing sector. Together with inflation running below target, the Vice Chair reiterated the Committee "will act as appropriate" to sustain the US's 11-year economic expansion. 


— — — 

The highlight from Australia this week was September's Labour Force Survey, which showed employment increased by a near-consensus 14.7k in the month. The unemployment fell against expectations from 5.3% to 5.2% to reverse the increase recorded in August as the participation rate eased from its record-high of 66.2% to 66.1% (see our review here). Meanwhile, the broader measures of spare capacity showed signs of improvement in the month given the underemployment rate fell from 8.5% to 8.3% and the undertilisation rate declined from 13.8% to 13.5%.

Against signals from forward-looking indicators pointing to an upcoming moderation, employment growth remains robust. If anything, the momentum looks to have strengthened recently. On net, employment lifted by 87.6k in the 3 months to September (average of 29.2k per month), which was its strongest quarterly increase since Q4 2017 (see chart of the week, below). This compares with outturns of 70.9k in Q1 and 70.0k in Q2. Through the year, employment growth remained at around 2.5%, which is up from a 2.2% pace at the end of Q2, and continues to run well ahead of growth in the working-age population (around 1.7%Y/Y). Robust labour demand continues to be met with a rising supply of workers, with participation rising by a net 85.0k in Q3. Longer-term this is a positive development for Australia because it will add to the nation's growth potential, though in the near term it is making it challenging for policymakers to reduce spare capacity in the labour market. Consider that despite the recent strength in employment, the unemployment rate (at 2 decimal places) was little changed over the quarter at 5.20% compared to 5.25% in June.


Chart of the week

With the unemployment rate well above the Reserve Bank of Australia's estimate of full employment of around 4.5% and an inflation outlook that remains below target, the minutes from October's policy meeting indicated the Board was prepared to cut the cash rate further. The decline in the unemployment rate in September saw markets price out expectations for the timing for the next rate cut to February-April 2020. Domestically, the key uncertainty around the Bank's economic outlook is how household consumption responds to recent monetary and fiscal stimulus, which is yet to be reflected in the hard data. Downside risks attend the outlook around residential construction given that activity has been contracting at a faster rate than the Bank had anticipated, while building approvals have continued to weaken. More positively, the Board remained relatively upbeat on the outlook for business investment, in both the mining and non-mining sectors. 
These minutes also revealed that before deciding to cut the cash rate in October, the Board went into an in-depth discussion around the current effectiveness of the transmission of an easing in monetary policy into the real economy. It was assessed that the cash flow boost to households' budgets from lower rates and exchange rate depreciation were the channels most likely to work much as they have done in the past. Regarding the latter, RBA Governor Philip Lowe was quoted as saying; "The exchange rate is a better stabiliser than our own monetary policy" during a panel discussion at an IMF conference in Washington on Friday. On the other hand, some concern was expressed that there could be a confidence impact on savers from low rates. Also acknowledged was that the flow-through to the residential building sector might be less impactful than in past easing cycles. This theme was covered in greater detail in a speech this week by the RBA's Deputy Governor Guy Debelle, noting that with turnover in the housing market at low levels, credit growth was also likely to remain low, while households constrained by low income growth and faced with tight lending standards were factors unlikely to drive an acceleration in borrowing. As such, the Board was sanguine to the risks to financial stability associated with an overinflation of house prices fuelled by low rates.

Wednesday, October 16, 2019

Australian employment 14.7k in September; unemployment rate 5.2%

Australian employment growth was strong over Q3 with a near-consensus 14.7k jobs coming through in September. The national unemployment rate reversed its increase in the previous month and is now back at 5.2%.   

Labour Force Survey — September | By the numbers
  • Employment increased by a net 14.7k in seasonally adjusted terms in September, which was essentially in line with the market's forecast of +15k. Employment in August was revised up from 34.7k to 37.9k.   
  • The national unemployment rate retraced its rise in August falling from 5.3% to 5.2%, where the consensus view was for no change this month. 
  • Underutilisation fell from 13.8% to 13.5% and the underemployment rate declined from 8.5% (revised from 8.6%) to 8.3%. 
  • Workforce participation eased by 0.1ppt from its record-high of 66.2% to 66.1% (exp: 66.2%). 
  • Aggregate hours worked lifted by a further 0.2% in September (prior 0.2%) to 1.79bn hours, though the annual pace eased a touch from 2.0% to 1.9%.


Labour Force Survey — September | The details 

The nation's unemployment rate declined by 0.6ppt in September to 5.20% when rounding the seasonally adjusted estimates at 2 decimal places. In trend terms, unemployment was steady at 5.25%. The participation rate declined slightly this month from 66.17% to 66.1% (seasonally adjusted), which equated to a modest 6.6k rise in the workforce. With employment rising by a net 14.7k, the unemployed total reduced by 8.1k to 709.6k. The composition of the 14.7k rise in employment was the net result of full-time work increasing by 26.2k and an 11.2k contraction from the part-time segment. 

In annual terms, employment growth remains at a robust pace of around 2.5% (full-time 2.2% and part-time 3.0%). Over the past 6 months, employment has risen at an annualised pace of 2.5%, though the 3-month annualised pace of 2.7% implies the momentum has picked up recently. 


Indeed, in net terms, employment increased by 87.6k in Q3, which is the strongest quarterly outturn since Q4 of 2017 and is well above the gains of 70.9k in Q1 and 70.0k in Q2. However, despite this, the unemployment rate was little changed over the quarter at 5.20% compared to 5.25% in June. Participation, on net, lifted by around 85.0k in Q3.  


In September, the underemployment rate (measuring those employed who want and are available to work more hours) fell from 8.5% to 8.3% and the underutilisation rate (combining those unemployed and underemployed) declined from 13.8% to 13.5%, though both measures lifted slightly by 0.1ppt each over Q3.


For the third consecutive month, aggregate hours worked increased, rising by 0.2% in September, though in annual terms growth is subdued at 1.9%. On average, hours worked per employee lifted by 0.1% in the month to 138.1 hours, however; the annual pace has been declining for 6 consecutive months now to -0.5%, which may help to explain the lack of progress in reducing spare capacity despite employment increasing at a robust pace. 

   
On a state-by-state basis, employment outcomes in the month and over Q3 were led by Queensland with rises of 25.3k and 37.5k respectively. There could be some signs of softness emerging in New South Wales given the state recorded a 23.0k decline in September and a rise of just 7.1k over Q3, though over the past year it has added 96.1k jobs of the 311.6k achieved on a national basis. Victoria has led employment growth over the past year, contributing 103.2k jobs, of which 8.6k came in September and 32.5k in Q3. 

In the other states, the outcomes were; Western Australia -5.9k in September (-5.4k in Q3), South Australia +1.5k (+1.1k) and Tasmania +2.2k (+3.8k).  

 
The unemployment rates across the states showed mixed moves in September and over Q3; 
  • New South Wales +0.2ppt to 4.5% (-0.1ppt in Q3) 
  • Victoria -0.2ppt to 4.7% (-0.1ppt in Q3) 
  • Queensland +0.1ppt to 6.5% (unchanged over Q3) 
  • Western Australia -0.1ppt to 5.7% (unchanged over Q3)
  • South Australia -1.0ppt to 6.3% (+0.3ppt over Q3)
  • Tasmania -0.2ppt to 6.2% (-0.5ppt over Q3)

Labour Force Survey — September | Insights

Today's report contains little to alter the Reserve Bank of Australia's assessment of the labour market. Though the Board would welcome the strong growth in employment over the quarter, it has also stated it anticipates the pace to slow based on the signals from the forward-looking indicators. Meanwhile, the unemployment rate continues to remain around 5.25% and the broader measures of spare capacity were also little changed over the past 3 months. Markets reacted to the fall in the unemployment rate by pricing out expectations for a November rate cut from around a 40% chance to 20%. This seems a justifiable reaction as there appear to be enough positive signals in the report to prevent the Board from cutting rates on Melbourne Cup day, though before then Q3's CPI report will be released (30/10) and this could be crucial in shaping what happens at the next meeting.    

Preview: Labour Force Survey — September

Australia's key Labour Force Survey for the month of September is due to be released by the ABS at 11:30am (AEDT) today. Employment is expected to increase moderately in the month, while the unemployment rate is forecast to remain at 5.3%.   

As it stands Labour Force Survey 

Following a much stronger-than-expected outturn in July, employment surprised to the upside in August rising by a net 34.7k compared to the consensus forecast for +15k. The annual pace of employment growth remains robust at 2.5%, while the 6-month annualised pace lifted from 2.2% to 2.6%, though the 3-month annualised pace eased from 2.4% to 2.2%.


For the 4th time in the past 5 months, the workforce participation rate saw a new record high after lifting from 66.1% to 66.2%. This equated to the workforce increasing by 38.8k in August, and as that outpaced the rise in employment of 34.7k, the unemployment rate increased from 5.2% to 5.3% to be at its highest level in a year. Broader measures of spare capacity also increased, with the underemployment rate rising from 8.4% to 8.6% and the underutilisation rate lifting from 13.7% to 13.8%.


Aggregate hours worked lifted by 0.2% in August, which saw the annual pace tick up from 1.9% to 2.0%. However, after adjusting for the strong increase in employment in the month, average hours worked per employee in August were flat at 137.9 hours to be down by 0.4% on the level from a year ago.   

Market expectations Labour Force Survey 

In today's report, the median forecast according to Bloomberg's survey of economists is for employment to rise by 15,000 in September, with individual estimates ranging from -11,000 to +32,000. The unemployment rate is anticipated to remain at 5.3% between a range of 5.2% to 5.4%, while the participation rate also expected to hold steady at 66.2%. 


What to watch Labour Force Survey

The Reserve Bank of Australia's policy-setting Board continues to observe a labour market with an elevated level of spare capacity. This was reiterated as recently as Tuesday earlier this week in the mintues from the October meeting, which noted
; "The unemployment rate had been around 5¼ per cent since April and the underemployment rate had remained above its recent low point". After cutting rates in June, July and October, the October minutes highlighted a preparedness to ease the cash rate further "if needed" to support GDP growth strengthening to trend, full employment and inflation returning to the 2-3% target band. Key in today's report will be the headline unemployment rate after it lifted to a 12-month high of 5.3% in August. Markets are pricing in around a 40% chance of a 25 basis point rate cut in November, though if the unemployment rate were to show another deterioration in September this could firm to well above 50%, while the Australian dollar would also come under renewed pressure.    

Friday, October 11, 2019

Macro (Re)view (11/10) | Progress in US-China trade talks

The resumption of US-China trade talks that broke down in July achieved progress this week, as top-level delegates from the world's two largest economies met in Washington and agreed on the outline of a partial deal, though the details are yet to be formalised. Tensions between the US and China have been an ever-present risk for markets over the past 18 months and have contributed to the slowdown in global economic growth as disruptions to established supply chains have impacted trade flows, while firms have curbed investment plans in response to the prevailing uncertainty. Reports on the negotiations over Thursday and Friday were generally constructive as both sides appeared focused on preventing another re-escalation of tensions by working towards a partial deal. Under the 'Phase 1' trade deal, the US will delay a planned increase in tariffs from 25% to 30% on a $250bn tranche of Chinese imports that was due to start next week, while in return China will up its annual purchase of US agricultural products to between $40bn and $50bn for the next 2 years. There were also agreements reached around certain intellectual property and currency provisions, though the more contentious issues of forced technology transfers, theft of intellectual property and industrial subsidies were set aside for the time being. 

Turning to US domestic events, the Federal Reserve's meeting minutes from September where the policy-setting committee cut its benchmark interest rate by 25 basis points to 1.75-2.0% were released. While the committee remains upbeat in its outlook conveyed by its baseline expectation for a continuation of the economic expansion, a robust labour market and inflation converging to target, its decision to cut was based on an intensification of downside risks, notably from trade tensions, a more fragile global growth outlook, and rising geopolitical risks. This theme was reiterated by committee Chair Jerome Powell during a speech this week and with 7 committee members assessing at the September meeting that rates would need to be lowered again before year's end, markets continue to expect another 25 basis point cut will be announced at this month's meeting that takes place on the 29-30 October.  

Over in Europe, the account of the European Central Bank's policy meeting last month were released. While members of the Governing Council were in agreement that the monetary policy stance needed to be eased to support inflation returning to its mandated target of below, but close to, 2%, there was a wide divergence of views around the proportionality of the response. Overall, the Governing Council agreed with the ECB's updated staff projections showing downgrades to the GDP growth outlook in 2019 and 2020 and assessed the risks "remained on the downside" due to geopolitical uncertainties, trade tensions, and emerging market vulnerabilities, while concerns around falling inflation expectations were also expressed. The consensus view was that a package of stimulus measures was required, though reservations were evident around individual elements  notably on restarting quantitive easing. 

Arguments for restarting monthly asset purchases were premised on demonstrating a commitment to acting in accordance with their mandate and to also prevent financial conditions from tightening, with long-dated yields relative to those at the front end of the curve identified as still potentially having more scope for compression. However, others had argued against this proposal, stating either that financial conditions were already sufficiently accommodative and asset purchases in this context would be less efficient in driving a further compression of the term premia, or that it should be seen as an option of "last resort" to be saved for a more severe deterioration in the outlook. The one area in which the Governing Council members are in agreement is that governments, where they have the capacity to do so, "should act in an effective and timely manner" as fiscal policy would be more effective in addressing the prevailing headwinds than a further easing of the monetary policy stance. 


Rounding out the week, the UK remains on track to avoid a technical recession but it is still an economy very much mired by Brexit-related uncertainty. After contracting by 0.2% in Q2, GDP growth over the 3-months to August was 0.3% with the annual pace slowing from 1.3% to 1.1%. The manufacturing sector is taking the brunt with activity contracting by 1.1% over the past 3 months, while firms are also faced with the headwinds from trade tensions and a weaker global economy. There were at least some constructive headlines on Brexit late in the week, with PM Johnson and Irish counterpart PM Varadkar issuing a joint statement saying they "could see a pathway to a possible deal" that would facilitate an orderly UK withdrawal from the EU.


— — — 

Developments in Australia during the week were highlighted by the latest surveys of business conditions and consumer sentiment, which continued to indicate that the flow-through from recent monetary and fiscal stimulus measures has to date been limited. The National Australia Bank's (NAB) Business Survey for September showed mixed outcomes for confidence and conditions, however both appear to be consolidating around well below-average levels, indicating that firms' investment plans may be at risk of being scaled back as has been the experience in other economies recently. Overall, business confidence fell from +1 to 0 and is around its weakest level in 6 years. Notably, confidence was weakest for manufacturing firms, with the sector mired in a global contraction due to trade tensions and weakening global economic growth, and also for construction firms as activity in the residential sector continues to roll over.

Business conditions saw a marginal improvement in September, rising from +1 to +2, but are well below the long-run average level of +6 and have endured a sharp slowdown over the past 12-18 months. While the trading and profitability sub-indexes improved by 1 point in the month to readings of +4 and -2 respectively, they both remain at below-average levels. In contrast to weakness in confidence and conditions, firms appear to remain willing to hire given the employment sub-index increased by 1 point to an above-average reading of +3 in the month. According to NAB's analysis, this indicates employment is forecast to rise by around 18,000 jobs per month over the next 6 months, though that would be a step down from recent outturns in the official data that have averaged around 26,000 jobs per month so far in 2019. Together with weak confidence, the leading indicators pointed to a continuation of existing conditions given that forward orders and surveyed capital expenditure are now at below-average levels, with the latter falling to a 5½-year low in September. 


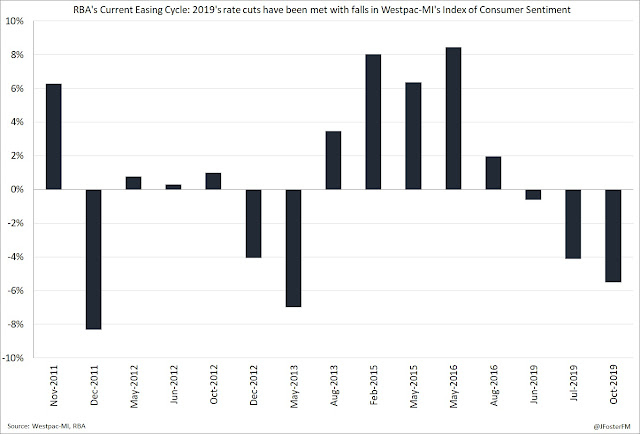
Turning to the consumer, pessimism deepened in October with Westpac-Melbourne Institute's Index of Consumer Sentiment showing a 5.5% deterioration to a 51-month low of 92.8. The survey was taken last week and captured responses to the Reserve Bank of Australia's (RBA) latest interest rate cut. As our chart of the week, below, shows, in this current easing cycle that commenced back in late-2011, consumer sentiment has generally risen in the months where the RBA has delivered rate cuts, however this has not been the case with 2019's rate cuts as sentiment has fallen by 0.6% in June, 4.1% in July and now 5.5% in October.


Chart of the week


Clear in this month's survey was that views towards economic conditions have deteriorated on a 12-month (-6.0%) and 5-year (-9.1%) outlook. This could suggest consumers have assessed 2019's rate cuts to be a response to a weakening domestic economy, while concerns over global developments may also be a factor. Against this backdrop, the outlook for spending is challenged as views on family finances relative to a year ago fell by 4.9%, while the assessment for the next 12 months was down by 3.7% in October. Thus, to date, it appears the RBA's rate cuts and the federal government's tax cuts have not yet taken hold with consumers, which appears consistent with last week's retail sales data for August (see here). 

The exception to this is in the housing market, with consumers' expectations for prices accelerating by a further 5.9% in October. Westpac reports that since May's federal election, the House Price Expectations Index is up by some 54%, likely reflecting the fading of uncertainty around potential changes in tax policy and the announcement of 3 RBA rate cuts. These developments appear to be bolstering activity, with this week's housing finance data for August confirming a 3rd straight monthly increase in the value of lending commitments to both the owner-occupier and investor segments (see here). In the investor segment, August's 5.7% rise in lending commitments was its fastest monthly increase in nearly 3 years and follows a 4.2% rise in July, while in the owner-occupier segment commitments were up by a more modest 1.9% in August, though this came after rises of 4.2% and 5.4% in the past 2 months. As a result, there appear to be renewed concerns over affordability, notably in New South Wales and Victoria, with the 'time to buy a dwelling' index in October's consumer sentiment survey sliding by 5.4% to a below-average reading of 116.6.