Independent Australian and global macro analysis

Wednesday, May 31, 2023

Australian Capex 2.4% in Q1; 2023/24 investment plans $137.6bn

Australian private sector capital expenditure increased by more than expected in the March quarter, extending its upswing since the middle of 2022. Equipment investment advanced at its fastest quarterly pace since 2021. Resilience in firms' forward-looking investment plans to a slower growth outlook remains intact.      

CapEx — Q1 | By the numbers
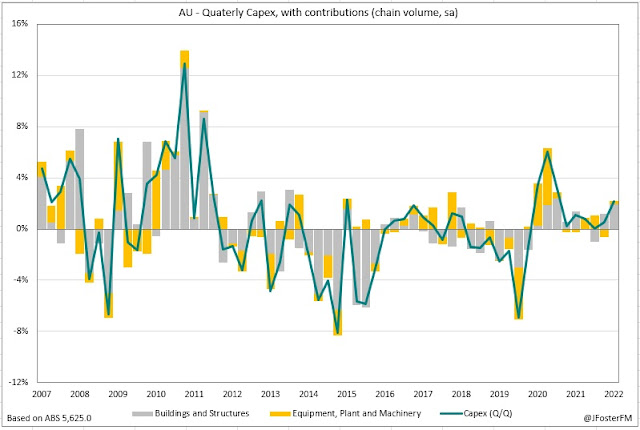
  • Private sector capex expanded by 2.4% in the March quarter, an upside result on the market estimate (1%), to be up 6.3% through the year. December quarter capex was revised to a 3% rise from 2.2% previously.  
  • Equipment, plant and machinery capex increased by 3.7% quarter-on-quarter, accelerating from a 0.6% gain in Q4, to be 5.8% higher in year-ended terms.  
  • Buildings and structures capex advanced by 1.3%, with growth through the year up at 6.8% from 4.9% previously. 


  • Firms' 6th estimate of capex plans for 2022/23 came in at $162.6bn, up 2.7% on estimate 5 from 3 months ago. Capex is on track for a year-to-year rise of 13.5%.  
  • Year-ahead investment plans for 2023/24 were posted at $137.6bn, 6.4% higher than the 1st estimate and 5% up on estimate 2 for 2022/23. 


CapEx — Q1 | The details

Capex by Australian firms has regained momentum after being subdued for much of last year. A 3% rise into year-end has been followed by a solid 2.4% increase in the March quarter (in real or inflation-adjusted terms). Equipment investment was up by 3.7% in Q1, its strongest quarterly rise in two years. Buildings and structures spending slowed to a 1.3% rise coming off a large increase (5.3%) in Q4.   


Non-mining investment (2.7%) rose at a similar pace to the previous two quarters, up overall by 8.4% since the middle of 2022. Equipment investment accelerated in Q1 (3.4%) as growth in the buildings and structures component moderated (2%). 


Over in the mining sector, capex rose modestly in the first quarter (1.7%), driven by investment in equipment (5.2%). Total capex in the sector remains little changed since 2017, following the unwind from the mining investment boom in the early part of the decade. 


Firms' investment plans in the current financial year were upgraded by 2.7% to a projected spend of $162.6bn (in nominal terms). This figure for estimate 6 was stronger than implied by the average historical upgrade from estimate 5 (around 1%), likely accounted for by high inflation. The latest estimate suggests that capex is on track to rise by 13.5% compared to 2021/22.   


Year-ahead investment plans were revised to $137.6bn in firms' 2nd estimate for 2023/24, up from $129.4bn on estimate 1, representing an upgrade of 6.4%. This is a softer upgrade than seen between estimates 1 and 2 in 2021/22 (7.8%) and 2022/23 (12.3%) and was also below my forecast for a figure above $140bn. But, overall, capex plans appear to remain resilient and are at their highest level since 2014/15, though inflationary effects are playing a role. Non-mining investment plans were raised by 8.1% on estimate 1 to $94.8bn and plans in the mining sector lifted by 2.7% to $42.8bn.  


CapEx — Q1 | Insights

A stronger-than-expected result for quarterly capex, driven by the equipment component. This suggests business investment supported economic growth through the first quarter of 2023. Forward-looking investment plans for 2023/24 may have come in a bit softer than anticipated, but there does not appear to have been a material reassessment by firms despite weak confidence and outlook for slower growth in Australia and offshore. 

Preview: CapEx Q1

Australia's March quarter capital expenditure survey is due to be published by the ABS this morning (11:30 AEST). The report provides an estimate of quarterly business investment - an input for economic growth calculations - as well as surveying firms on their spending plans. A 1% rise in quarterly capex is expected, while the resilience of investment plans will be tested by slower growth and weak confidence.   

As it stands Capital Expenditure

Capex, a partial indicator of business investment, lifted by 2.2% (in inflation-adjusted terms) in the December quarter to be up by 3.6% through the year. This extended its strong rebound coming out of the pandemic, with capex 7.1% higher than at the end of 2019. 


Real spending on buildings and structures posted a 3.6% rise in Q4 for an overall rise of 6% in the second half of the year. Equipment spending was a modest 0.6% higher in Q4 and has largely plateaued over recent quarters; however, this follows a strong upswing out of the pandemic that was supported by stimulus measures and the recovery in demand. 


Non-mining sector capex expanded by 2.8% in Q4 and was 5.6% higher than its pre-pandemic level. Capex in the mining sector remains around its subdued levels from recent years, despite the tailwinds from elevated commodity prices. 

Forward-looking investment plans (in nominal terms) were upgraded by 2.2%, pointing to a total spend of around $159bn in 2022/23, according to the 5th estimate. That puts capex on track for a 12.6% rise compared to 2021/22; however, this uplift includes an inflationary component. Year-ahead plans for 2023/24 were a notional $130bn. 


Market expectations Capital Expenditure

The median estimate is for capex to rise by 1.0% in the March quarter, with forecasts ranging from -0.5% to 2.5%. Today's survey will also include revised estimates of investment plans for 2022/23 (estimate 6) and 2023/24 (estimate 2). 

Based on the history of the survey, estimate 6 is likely to be revised around 1% higher to a figure of around $161bn for 2022/23. There is considerably more uncertainty around estimate 2 for 2023/24. In the past two years, the upgrades from estimate 1 have been robust at around 15%, though these upgrades came amid strong economic conditions and rising inflation. I anticipate a more conservative uplift on this occasion of around 10%, equating to a forecast of around $144bn for 2023/24. 

What to watch Capital Expenditure

The forward-looking investment plans component tends to gain most of the attention from this release and that is likely to be the case again today. That said, the capex outcome will be a key input shaping expectations for Q1 GDP. Regarding investment plans, the NAB Business Survey over recent months has been reporting a divergence between conditions - remaining robust - and confidence - falling to weak levels. To date, investment plans have been resilient to slower growth, both domestically and offshore. The key question is whether this resilience in the investment outlook holds up.  

Tuesday, May 30, 2023

Australian construction activity 1.8% in Q1

Australian construction activity increased more sharply than anticipated in the March quarter. Progress in working through the vast pipeline of public sector infrastructure projects has accelerated. Headwinds continue to hold back progress in the home building sector. 

Construction Work Done — Q1 | By the numbers
  • Construction activity expanded by 1.8% in the March quarter - stronger than the expected rise (0.5%) - and by 5.1% through the year. Work done in Q4 was revised to a 1% rise from a 0.4% fall. 
  • Segment details were:
    • Engineering work increased by 5.3%q/q (from 2.4% in Q4) to 14.9%Y/Y.
    • Building work contracted by 1.1%q/q (from -0.2%) to be down by 2.2% over the year. 
      • Residential work fell 2% (from a 0.9% rise in Q4) for a decline of 5.1% in year-ended terms. 
      • Non-residential work was broadly flat at 0.3% in Q1 (from -1.7%) but increased by 2.2% through the year.


Construction Work Done — Q1 | The details 

Activity in the construction sector rose by 1.8% overall in the March quarter around contrasting outturns from engineering (5.3%) and building work (-1.1%). This extends the strong momentum in engineering work seen over the back half of 2022 - where activity expanded by 7.8% - as progress on infrastructure projects ramps up. Building work lifted at a moderate pace for the second half last year (2.5%), progress that has slipped in early 2023.


The key dynamic in the quarter was the sharp lift in public sector construction (4.9%); in comparison, private sector construction lifted by only 0.6%. Work done by the public sector has expanded by 13% through the year to the March quarter, with engineering (18.1%) the main component. Governments across Australia have brought forward infrastructure projects (partly associated with the pandemic response) and the pace of that work has lifted as capacity constraints and weather-related disruptions have eased. 


This has led to an associated lift in private engineering work (3.8%); however, private sector construction activity increased only slightly overall in Q1 (0.6%) and at a modest pace over the past year (2.3%). Building work has weighed, contracting in the most recent quarter (and declining in 3 of the past 4 quarters) to be down 2.6% through the year. 


Private residential work has fallen by almost 5% over the past year. New home building (-2.6%q/q) has been surprisingly weak (-4.8%), with an easing in delays and disruptions unable to boost progress in working through a substantial pipeline of new homes. Alterations have been unwinding from their pandemic highs (-4.2%Y/Y); however, they posted a 2.7% rise in Q1. 


Non-residential construction work rebounded alongside the recovery from the pandemic recession, but that uptrend has slowed over recent quarters. Cost increases may have led to many firms delaying projects.    


Construction Work Done — Q1 | Insights

On the positive side, today's report suggests public demand will add solidly to GDP growth in the March quarter (with expenditure data due early next week to complete the picture). The rise in private sector non-residential work is a positive lead for business investment (capex data tomorrow will provide more insight), coming off the back of a contraction into year-end. The weak point is private sector home building with Q1's sharp contraction set to weigh on quarterly GDP. 


Preview: Construction work done Q1

Australia's construction activity report for the March quarter is due to be released by the ABS this morning (11:30 AEST). Construction activity picked up over the back half of last year as supply constraints eased and weather-related disruptions cleared. The sector continues to face headwinds, but activity is expected to have advanced in the first quarter of 2023.   
 
As it stands Construction Work Done

It was a year of two halves in 2022 for construction activity. Wet weather and supply constraints hampered activity in the first half (-2.2%) before an easing of these headwinds cleared the way for a second half rebound (3.3%). In the most recent quarter, however, construction activity surprised with a modest 0.4% fall. 


Private sector construction work expanded by 2.8% overall in the second half but declined by 1.5% in the December quarter. Weakness in the non-residential segment (-7.5%) drove the quarterly fall. Residential work lifted by 0.9% in Q4 with new home building gathering momentum (2%) as renovations continued to unwind from their pandemic highs (-5.1%). Engineering work was a headwind, reported to have contracted 0.8% in Q4. 


Work done in the public sector advanced by 2.6% in the December quarter and by 4.7% in the second half of the year. Governments across Australia are working through an expansive pipeline of infrastructure projects, driving a 3.5% lift in engineering work into year-end. Public building also increased by 0.3% in Q4 to be up by 4.8% through the year. 


Market expectations Construction Work Done 

A 0.7% rise in construction activity is expected in the March quarter; this is around a wide range of estimates from -1.5% on the low side to 2% on the high end.  

What to watch Construction Work Done

The focus largely remains on residential construction. Record numbers of homes are under construction in Australia following the stimulus measures and the uplift seen in housing prices during the pandemic. Supply constraints in the availability of materials and labour have been major headwinds to working through the housing pipeline. More recently, insolvencies in the sector have picked up 
as a result of the cost increases builders have faced over an extended period. Meanwhile, building approvals have fallen to decade lows reflecting rising interest rates and the associated falls in housing prices.    

Monday, May 29, 2023

Australian dwelling approvals fall to 11-year low in April

Australian dwelling approvals fell to an 11-year low in April as rising interest rates, earlier falls in housing prices and weak sentiment continue to impact the home building sector. Approvals have halved over the past couple of years as the sector has been working through record numbers of houses in the pipeline. 

Building Approvals — April | By the numbers
  • Dwelling approvals (seasonally adjusted) fell by 8.1% (vs 2% exp) in April to 11,594, its lowest since April 2012. Approvals declined by 24.1% over the year and are now 50.1% below the cycle high in March 2021.  
  • House approvals were down 3.6% on the month to 8,049 (-18.2%yr), remaining around decade lows. 
  • Unit approvals declined by 16.9% to 3,545 (-34.9%yr), the lowest monthly total going back to January 2012. 


Building Approvals — April | The details  

A further decline in the month of April saw dwelling approvals fall to their lowest level in 11 years at around 11.6k. Approvals have halved from their March 2021 peak; the unwind set in well in advance of the RBA's rate-hiking cycle (from May-22) following the earlier conclusion of construction stimulus measures from state and federal governments as part of their economic response to the pandemic. 


3-month (average) approvals for houses have fallen to around 8.3k, their lowest in 10 years. Unit approvals held up around 6k (3-month average basis) throughout last year but have dropped away sharply in 2023, falling to around the 4k range; high-rise and townhouse approvals have been prominent in that slide. 


Approvals for renovations (nominal terms) remain at an elevated level ($0.95bn) in April; however, the national accounts (next edition is due next week) have reported that the volume of work has been falling over recent quarters. Cost pressures, therefore, are keeping these approvals elevated.    


Building Approvals — April | Insights    

Another weak report for dwelling approvals today, which (if anything) suggests the unwind has accelerated through the early part of 2023. Approvals have more than reversed the stimulus-driven surge they saw in the recovery from the pandemic recession. Rising interest rates, a downswing in housing prices and weak sentiment have combined with the earlier conclusion of construction subsidies to drive approvals lower. Approvals are adding little to the pipeline at time when population growth post the pandemic is ramping up.  

Friday, May 26, 2023

Macro (Re)view (26/5) | Powering on

Although a resolution to the US debt ceiling remains elusive, robust data and a Fed remaining open to hiking rates further have continued to push bond yields higher. US dollar strength remains a key factor in markets. Outperformance in US equity markets was notable this week as the tech sector surged. 


The minutes of the FOMC's May meeting highlighted uncertainty around whether it had hiked rates sufficiently to put inflation on the glide path back to the 2% target. That came as the key core PCE deflator printed above expectations in April at 0.4%m/m and 4.7%yr. Meanwhile, real consumption was continuing to expand at a solid pace (0.5%m/m/2.3%yr). 


The FOMC acknowledges that the full effects of its hiking cycle remain in the pipeline and that the regional bank failures imply an additional tightening impulse in credit conditions; however, a tight labour market and high inflation (with upside risks to the outlook) remain in focus. FOMC members come to differing interpretations on the balance of these considerations: "some participants" support more tightening but "several" members are of the view that more hikes may not be needed. In a speech, Fed Governor Waller said it was possible that the data (and other circumstances) could make the case to "skip" hiking rates in June; however, he does not believe that the FOMC has reached its peak rate.     

UK inflation surprised to the upside in April, with markets now pricing four additional rate hikes from the BoE to take the peak rate to 5.5% (from 4.75% previously). Headline inflation declined from 10.1% to 8.7% (vs 8.2% exp) - the fall mainly reflecting the unwind from surging energy prices a year ago - but it was the rise in the core rate from 6.2% to 6.8% (vs 6.2% exp) that came as a shock. A lift in services inflation to 6.9% suggests the persistent inflationary risks the BoE is hiking rates to guard against will require more attention. To this point, BoE Governor Bailey reiterated to the Treasury Committee this week that wage and price settings remain the key factors shaping the inflation outlook. 


The euro area composite PMI slowed to 53.3 in May, a reading consistent with modest growth as a resilient services sector (55.9) continues to support the economy. This widened the divergence to the manufacturing sector (44.6) where both output and new orders in decline. Inflation dynamics also vary significantly, with labour costs keeping price pressures elevated for services, while falling energy prices and improved supply chains are weakening inflation in manufacturing.

Source: S&P Global 

Headwinds to household spending in Australia saw retail sales stall in April (reviewed here). Despite rapid population growth adding to demand and higher prices, nominal sales have plateaued over recent months. Across the Tasman, the RBNZ hiked rates by 25bps to 5.5% but dialled down its hawkish messaging materially. The Committee signalled that rates have reached their peak and expressed confidence that remaining at this restrictive level will bring inflation back to its 1-3% target range. 

Thursday, May 25, 2023

Australian retail sales stall in April

Australian retail sales slowed to the point of stalling in April, coming below expectations (0.3%) after a 0.4% rise in March. Cost-of-living pressures and rising interest rates continue to weigh on spending, with weak household sentiment another headwind. This was a weak start to the quarter after underlying sales volumes contracted in Q1 (-0.6%), despite strong post-pandemic population growth adding to demand.  


Headline retail sales were unchanged on the month and lifted by just 0.1% on an ex-food (or discretionary) basis. The 3-month averages for headline (0.2%) and discretionary sales (0.1%) indicate the momentum in retail spending has just about stalled.  
 

Retail sales started 2023 strongly posting a 1.9% rebound in January, but since then the level of sales has largely plateaued. Over that period (to April), headline sales have increased by 0.6% and discretionary sales are up by 0.3%. Price rises (albeit slowing in the sector) and population growth are factors that have prevented outright falls in monthly sales over recent months.    


Across the categories, clothing and footwear sales rose sharply by 1.9%, the increase attributed to the earlier-than-usual onset of cooler weather in Australia. Department stores saw a 1.5% rise on the back of this. 

Although spending at cafes and restaurants softened in April (-0.2%), turnover remains at a very elevated level (up 34% on pre-pandemic levels) and is continuing to be supported by reopening dynamics; the ABS noted for example that the AFL's Gather Round and the LIV Golf tournament boosted spending in South Australia. The post-pandemic rotation to services spending continues to weigh on household goods (-1%), with spending in the category well down from its late-2021 peak. 

Food sales weakened in April (-0.1%) and posted their first month-on-month decline since February-2022. Higher food prices in Q1 (running at 6.8% over the year) may have led to reduced stockpiling by households as underlying volumes were flat.


Overall, this was a weak retail sales report, with population growth and prices holding monthly sales up enough to keep a decline at bay. Total household spending is likely stronger than implied by today's report given the resilience in the services sector; however, demand has slowed considerably since the middle of last year as cost-of-living pressures and rising interest rates have impacted.  

Friday, May 19, 2023

Macro (Re)view (19/5) | US finds renewed strength

A reappraisal of the interest rate outlook in the US was the key development in markets this week. Equities advanced on the back of improved sentiment, while the US 2-year yield saw its strongest weekly rise in 8 months as Fed rate cut expectations moderated, which in turn was a tailwind for the US dollar. 


Rates repricing boosts US dollar

US bond yields moved sharply higher this week supporting the dollar. This was helped by optimism around an agreement to lift the debt ceiling and easing concerns over US regional banks. Many Federal Reserve officials spoke during the week, with the commentary indicating to varying degrees that the door was not closed on a June rate hike. Markets continue to expect a June pause (though a higher chance of a hike is being discounted) but pricing for rate cuts at the back end of the year has been scaled back by some 25bps. Data consistent with a resilient US economy also factors into higher bond yields. Retail sales at 0.4% in April missed on the consensus forecast, but sales in the control group (more closely aligned with household spending for GDP calculations) were higher than anticipated at 0.7%, posting its 2nd strongest rise in the past year.


Australian labour market data underwhelm... 

Key labour market data underwhelmed this week, validating the market's view that the RBA will revert to a pause in June. The Wage Price Index was light relative to expectations at 0.8% in the March quarter (vs 0.9% expected). That saw the annual pace rise from 3.3% to 3.7%, a decade high in Australia but vastly more subdued than the wage pressures seen in the US and UK. It also remains in the range the RBA estimates is consistent with 2-3% inflation (assuming productivity growth of around 1%). Looking ahead, the RBA has wages growth peaking at 4% by year-end, though as discussed in my review (here) the recent momentum suggests that level is not assured. That said, the report also showed a rising share of jobs receiving larger pay increases, which a hawkish RBA may give more weight to. 


April's labour force survey was weak across the headline numbers, though the report warrants caution due to seasonal effects around Easter (reviewed here). Employment fell by 4.3k in the month (vs +25k) resulting in the unemployment rate rising from 3.5% to 3.7%. That went against a strong first quarter for employment (with those increases revised higher), and labour force participation was also slower falling to 66.7% in April. The other factor in need of close consideration is that hours worked were reported to have surged by 2.6% in the month despite more than 5 million people being on annual leave over Easter. 


... as the focus turns to the RBA

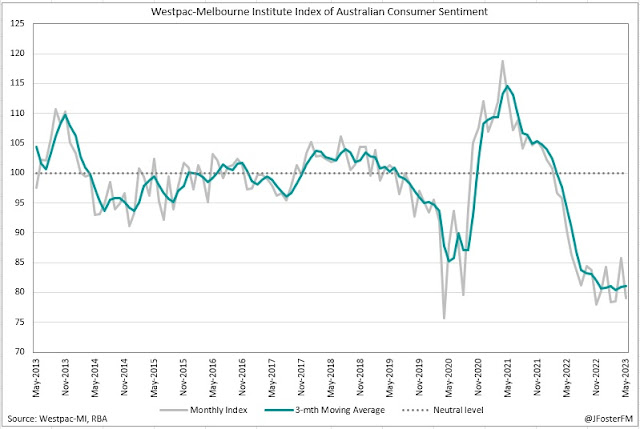
Markets have come to their conclusion but it remains to be seen how the RBA viewed this week's data. As was the case earlier this month, the Board can surprise. The May meeting minutes highlighted it decided to hike rates given that inflation was not anticipated to return to target until 2025 (as it had previously forecast) and there were risks that meant that timeframe could prove optimistic. Markets (fully priced for a hold) were caught offside by the May hike, but so were households. Consumer sentiment on the Westpac-Melbourne Institute Index plunged by 7.9% in May, its largest one-month fall since mid-2020. That decline also reflects the reaction to last week's Federal Budget. 


BoE remains on message

speech from BoE Governor Bailey was true to the message from last week's meeting where the MPC hiked rates by 25bps. Although the BoE's forecasts (largely based on Bank models) have inflation falling materially below target by 2025, there is a risk that inflation is more persistent. And, with that in mind, more tightening is possible. Some of that tightening will be delivered by the BoE running down its balance sheet, but as Governor Bailey and MPC members Broadbent and Ramsden told the Treasury Committee this week, the effect of quantitative tightening is expected to be small. 

Key to the risk of persistent inflation are developments in the labour market, in particular the implications for wages growth. This week's data suggested labour market conditions remained strong overall. Employment outperformed expectations rising by 182k in the 3 months to March (vs 160k), though the unemployment rate ticked up from 3.8% to 3.9%. Wage pressures remain elevated, but earnings growth (ex-bonuses) at 6.7%yr came in softer than anticipated. The overlay is that pay disputes are causing significant disruptions in the UK; the ONS reported more than 550k working days were lost in March due to industrial action, up from around 330k lost days in February.  

Euro area economy hanging in there  

Although growth in the euro area economy is weak - Q1 GDP was 0.1% after stalling in the prior quarter - recession remains at bay. ECB Vice President de Guindos said that while the central bank had upwardly revised its own forecasts (that factored in a recession), the effect of tighter credit standards reported in the recent Bank Lending Survey on the economy was only starting to play out. On the euro area banks, de Guindos in a speech said that the economic outlook presented risks to banks' profitability that required monitoring, but for the time being the euro area system had been resilient amid the bank failures seen in the US and Switzerland. ECB Executive Board Member Schnabel made the case for further rate hikes, outlining that liquidity tools could be used to support financial stability if required. 

Wednesday, May 17, 2023

Australian employment -4.3k in April; unemployment rate 3.7%

Australia's unemployment rate lifted to 3.7% in April as employment fell unexpectedly. Today's report came against the run of play from the first quarter of the year where a reacceleration in employment held the unemployment rate close to cycle lows amid rapid post-Covid population growth. My interpretation is that seasonal effects around the Easter holiday period have been at play in today's report. 
    
Labour Force Survey — April | By the numbers
  • Employment fell (on net) by 4.3k in April, well below the median estimate (25k) and weaker than the most pessimistic forecast (0k) in the survey of economists' estimates. March's employment outcome was revised up to 61.1k from 53k reported initially. 
  • National unemployment rate rose from 3.5% to 3.7% (vs 3.5% expected). The underemployment rate declined from 6.2% to 6.1%, leaving underutilisation little changed around 9.8%.  
  • Labour force participation declined from record highs in March at 66.8% to 66.7% in April. 
  • Hours worked accelerated by 2.9% in the month, despite weaker labour market conditions and the Easter holiday period falling in the middle of the reference period.


Labour Force Survey — April | The details

April's labour force report was soft across the key details. Employment fell resulting in a rise in unemployment, which came alongside lower labour force participation. As highlighted in my preview, the Easter holiday period fell during the reference period for the April survey, so today's report shaped as a bit of a wildcard. In the event, the report has come in weak relative to expectations and compared to recent months. 

Headline employment fell by 4.3k in April, the net result of a 27.1k fall in full time employment and a 22.8k rise in part time employment. This was the weakest outcome for employment since December last year (-7.7k). However, employment in prior months was revised higher in today's report. Employment in the first quarter of the year was revised up by around 11k to 117k, the strongest quarterly rise since Q2 2022. 


After incorporating the upward revisions and the weak outcome for April, momentum in employment still remains solid. The 3-month average pace of employment was 36.1k, while on a 3-month annualised basis employment growth is around 3.2%.  


The unemployment rate lifted from 3.5% to 3.7%, returning to its level at the start of the year. While inward migration is increasing at a rapid pace, the labour force recorded its slowest increase (14.1k) in 4 months, well down from an average of almost 41k per month in Q1. This saw the participation rate ease from record highs in March (66.8%) to 66.7% in April. 


Whereas unemployment rose in April, underemployment fell (6.2% to 6.1%) and total underutilisation was broadly unchanged at 9.8%. That combination of outcomes is unusual. A key factor in this may have been that total hours worked were reported to have surged by 2.6% in April. 


Rising hours came despite falling employment (and higher unemployment). It also came with around 5.1 million Australians on annual leave over Easter. The ABS explained in the release that in 2015 - when Easter fell at a similar time to 2023 - more people took annual leave back then (5.2 million) than they did this year.  


Labour Force Survey — April | Insights

Overall a messy report today and one which is difficult to draw many conclusions from. Taken with an underwhelming rise in wages growth in Q1 reported yesterday (see here), the RBA may revert to a pause in June as it did in April when it elected to wait for more data to "... assess the state of the economy and the outlook, in an environment of considerable uncertainty." But after the surprise decision earlier this month to start hiking again, it is difficult to be confident in predicting how the Board may have read this week's labour market data.