Independent Australian and global macro analysis

Tuesday, February 28, 2023

Australian economy expands 0.5% in Q4

Growth in the Australian economy slowed to 0.5% in the December quarter, coming in below most estimates for around 0.8%. Growth through the year stepped down from 5.9% to 2.7%. Today's national accounts put the outlook for household consumption into 2023 under the spotlight; the post-pandemic recovery now looks to be complete and the headwinds from cost-of-living pressures and rising interest rates are still impacting. 


There was a sharp slowdown in household consumption in the second half of 2022 (1.3%) from the first half (4.1%). In Q4, the pace weakened to 0.3% (5.4%Y/Y). The rotation in demand initiated by the full reopening of the economy was still unfolding, boosting services (1.2%) but weighing on goods (-1%).     


The squeeze on household budgets caused by cost-of-living pressures has been historically significant, with real disposable income contracting by 2.2% over the past year. Consumption has been able to rise strongly in spite of that backdrop, supported by the reopening of the economy, more than $200bn of excess savings built up over the pandemic, and the strong labour market.  However, high inflation has progressively made households worse off, reflected in the reduction in saving. In Q4, the household saving ratio declined from 7.1% to 4.5%, its lowest level in several years. 


Rising interest rates have amplified cost-of-living pressures. Interest payment as a share of nominal disposable income lifted to its highest in 8 years (5.4%). This is only slightly above the 5% level seen in the years preceding the pandemic, but the pace of the move has been rapid, rising from a 3% share before the RBA's first rate hike in the current tightening cycle in May last year. 


More broadly, the national accounts painted a picture of soft demand into year-end. Domestic demand growth stalled in the quarter on the back of soft household consumption (0.3%), weak business investment (-0.8%) and public demand that was little more than flat (0.3%). 


Headline GDP growth was boosted by a substantial contribution from net exports (1.1ppt). However, this was due much more to declining imports (-4.3%) (which boosts GDP) than strength in exports (1.1%), consistent with that overall picture of soft demand.   


More to follow. 


Australia Current Account $14.1bn in Q4; net exports 1.1ppts

Australia's current account surplus rewidened to historic highs in the December quarter. Elevated commodity prices continue to bolster national income. The post-pandemic recovery in services continued at pace for exports but imports lost some momentum.   

Balance of Payments  — Q4 | By the numbers
  • Australia's current account rewidened to $14.1bn in Q4 (vs $5.5bn) from a revised $0.8bn in Q3 (-$2.3bn initially reported). 
  • The trade surplus expanded by $9.5bn in the quarter to $40.9bn. Export earnings lifted by 3% to $177.1bn and import spending declined by 3.1% to $136.1bn. 
  • The income deficit narrowed from a record wide in Q3 ($30.4bn) to $26.4bn in Q4 as returns to foreign investors declined.  
  • Net exports are forecast to add 1.1ppts to Q4 GDP.


Balance of Payments — Q4 | The details 

Australian exports continued their post-pandemic recovery advancing by a further 1.1% in the December quarter, with the value of those exports rising by 3%. Export volumes are still down by almost 6% on their pre-pandemic level from three years ago. 

Services drove export volumes in Q4 (9.8%) and over the past year (46.4%) on the reopening of the international border. Resources exports saw a 2.5% rebound in Q4 (from a 0.9% fall in Q3) but growth over the past year has been modest (2.5%) after being affected by weather-related disruptions. Rural goods (-3.5%) softened after surging through the middle of the year (up 15.9% over Q2 and Q3) as global supply disruptions associated with the war in Ukraine increased demand for Australian produce, particularly wheat.  


Import volumes (-4.3%) contracted for the first time in 5 quarters, with the value of imports also falling (-3.1%). This weakness follows a very strong recovery from the pandemic; import volumes in Q4 were 7.7% higher than on the eve of the Covid crisis at the end of 2019. The Q4 decline in imports looks indicative of a softening in demand conditions, which has likely been weighed by higher prices stemming from the pressures that have affected global supply chains. Consumption (-3%) and capital goods (-5.3%) both saw sizeable falls.  

Services imports surprised with a 6.5% fall in the quarter, with offshore travel pulling back a touch into year-end (-6.2%). Remarkably, services imports are still almost 30% below their pre-pandemic level; however, they have to a large extent driven the rise in imports over the year.


Balance of Payments — Q4 | Insights 

Overall, the ABS reports net exports are likely to add a significant 1.1ppts to quarterly GDP growth. That looks to offset a large decline from inventories (estimated at -0.8ppt).

Broadly speaking, exports are still in recovery mode from the pandemic, while imports may be starting to soften as the headwinds from high inflation and monetary tightening impact; however, the recovery in services imports still has a long way to run.   

The current account surplus rebounded strongly in the quarter to sit back at historic highs above 2% of nominal GDP (based on Q3 GDP). The run-up in the current account surplus has followed a surge in the terms of trade to record highs over the course of the pandemic, boosting national income in the process. Despite retracing more recently, commodity prices are still elevated and this remains a tailwind for the Australian economy.   

Monday, February 27, 2023

Australian retail sales rebound 1.9% in January

Australian retail sales lifted 1.9% in January, above market expectations for a 1.5% rise. This result followed a large decline in December (-4%) after Black Friday discounting boosted November sales ahead of Christmas (1.7%). A 2.9% rise in discretionary (or non-food) sales drove the rebound.  


A similar pattern was seen last year, with January-22 sales rebounding by 1.8% after a pullback in December (-3.8%), though November-21 sales surged to a much greater extent (6.6%) as lockdown reopenings combined with Black Friday.

Overall, retail sales in January-23 were just below their level in September-22, with non-food sales around their July-22 level. This looks consistent with the sharp slowing in retail volume growth over the second half of the year (0.1%) from the first half (1.6%). Rising prices weighed on demand in the retail sector, though there was also a broad rotation in spending back to services occurring as the effects of the pandemic dissipated.   


The one services-related category captured in the retail report - cafes, restaurants and takeaway services - reflected this shift in spending patterns, with volume growth holding up in Q4 (0.3%) compared to falls in goods-based areas such as household goods (-2%), clothing and footwear (-2.3%) and department stores (-2.9%). 

In January, there were broad-based rises in spending. Department stores saw the strongest rise (8.8%) but that came after a much larger fall in December (-14.3%). The ABS noted spending on cafes and restaurants and takeaway services (1.2%) advanced to new record highs in the month supported by sporting and cultural events over the peak holiday period and rising prices.  

ABS chart 

Sunday, February 26, 2023

Australian Business Indicators Q4: Inventories -0.2%

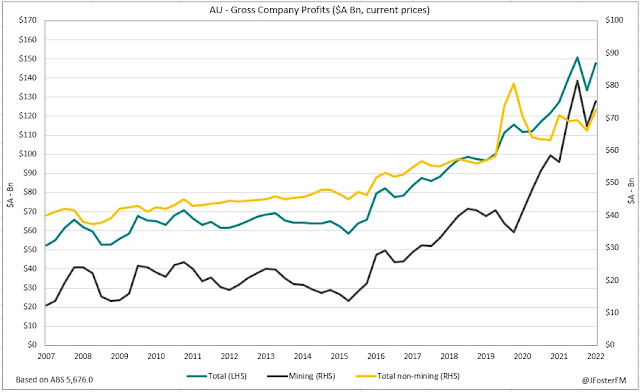
Australian business profits lifted strongly in the December quarter as sales slowed in a patchy demand environment. Inventory levels declined slightly after a strong post-pandemic rebuild. 

Business Indicators — Q4 | By the numbers 
  • Inventories declined by 0.2% in the quarter, broadly as expected (0% f/c), and expanded by 5.9% over the year. 
  • Company gross operating profits lifted by 10.6% in Q4, mostly rebounding from a fall in Q3 (-11.5%). Profits lifted by 16% through the year. 
  • Wages and salaries increased by a further 2.6% in the quarter, lifting the pace of growth over the year to 11.6%. 
  • Sales stalled in Q4 (0.1%) seeing their weakest outturn since the Delta lockdowns in 2021, slowing year-ended growth from 7.3% to 3.4%. 

Business Indicators — Q4 | The details

Australian business conditions were mixed in the December quarter. Sales remained at a very elevated level - up 6% on their pre-pandemic level - but flatlined in Q4 (0.1%) after rising very strongly in the three previous quarters. 


The underlying detail for sales was patchy. The mining sector saw a 2.6% lift, while the recovery from the pandemic continued to boost services including in hospitality (1.5%) and arts and recreation (3.2%). Other industries such as retail (-0.3%), wholesaling (-1.1%) and manufacturing (-1.4%) saw a cooling in demand, consistent with the rotation in demand to services. 


Despite the soft quarter for sales, company profits rebounded strongly from a fall in Q3, with firms raising prices in response to margin pressures. Non-mining sales declined by 0.2% in the quarter, but profits increased by 9.6%. In the mining industry, sales lifted by 2.6% while profits jumped by 11.6% but after falling 17.3% in Q3. Company profits overall lifted by 10.6%, but after adjusting for inventory valuation changes, the rise was a little more than 6%.


Labour costs for firms remained on the rise. Wages and salaries lifted by 2.6% in the quarter, a strong pace but moderating from the high in Q2 (3.4%). That left wage costs up 11.6% over the year; this acceleration reflects the recovery in hours worked as the pandemic dissipated and very strong labour demand. 


Inventory levels declined slightly in the quarter (-0.2%). This follows a very strong rebuilding effort over much of the past year as supply bottlenecks eased coming out of the pandemic. This will result in a drag on quarterly GDP from inventories. 


Business Indicators — Q4 | Insights

A mixed picture of demand in the December quarter. The rebound from the pandemic is still supporting some areas of demand, though other industries are seeing softer demand. Firms have raised prices in response to margin pressures, which looks to have bolstered profits. Mining profits remain very elevated and will continue to support national income. Inventories are a negative for Q4 GDP, potentially taking as much as 0.8ppt away from growth, though the actual outcome can vary substantially from these estimates. 

Friday, February 24, 2023

Macro (Re)view (24/2) | Fed remains on guard

A predictable response from markets this week to an upside surprise on the inflation gauge watched closely by the Federal Reserve, with equities lower and bond yields rising. Geopolitical factors also played into weak risk sentiment. Other developments of note this week included inflation in Japan rising to a four-decade high and the RBNZ continuing with its hiking cycle. 


FOMC minutes underscore the Fed's determination

Although markets latched onto the theme in Fed Chair Powell's post-FOMC meeting press conference that a "disinflationary process" was underway in the US, that message was notably absent in the meeting minutesIndeed the overall tone was consistent with the FOMC still being wary that policy was not yet "sufficiently restrictive" to lower inflation back to the 2% target. In the final analysis, "almost all" FOMC participants agreed to step the pace of tightening down to a 25bps rate hike, though "a few" members had supported a 50bps hike. 

The upside surprise on the closely watched core PCE deflator, which rose unexpectedly to 4.7%yr in January (vs 4.3% expected) from 4.6% previously could liven up the 25 or 50bps debate going forward. There was a resurgence in demand in the month as real personal spending lifted by 1.1% (with services 2.2% & goods 0.6%), its strongest rise in nearly 2 years. This fits with the strength of other data points seen over recent weeks, including the 517k surge in nonfarm payrolls in January.  


RBA's hawkish tilt followed higher inflation data in Q4... 

More colour around the RBA's recent hawkish tilt was provided in the February meeting minutes. After the Q4 inflation report surprised the RBA on the upside and with several factors still working to support demand, the Board took a pause in the tightening cycle off the table - an option it considered in December - narrowing the decision to one between a rate hike of 25 or 50bps. 

In siding with the former, the minutes noted the Board was taking into account the lags of the cumulative tightening in monetary policy, recognising also that moving more slowly was the appropriate course given the uncertainty of the economic outlook. However, the Board strengthed its guidance around the expectation for "further increases in interest rates" and brought this into prominence with the observation the cash rate was "lower than policy rates in many other comparable economies". As recently as late last year, the RBA had been highlighting that the speed of its tightening cycle was at the faster end of the scale amongst its central bank peers. 

... but wages growth surprised to the downside  

The Board retains its risk management approach to setting policy in an environment where it had seen "the incoming data on prices and labour costs had tended to exceed expectations". In that sense, this week's Q4 Wage Price Index report (see here) went against the grain as wages growth printed at 0.8% in the quarter and 3.3% over the year, coming in on the low side of the RBA's end of 2022 forecast (3.5%). 


In the context of the tightening that has occured in the labour market over the past year where the underutilisation rate has declined from an average of 12.5% in Q4 2021 to 9.4% in Q4 2022, the rise in wages growth over that period (2.4% to 3.3%) has been slower than the historical relationship would suggest. Australia's wage-setting processes take time to respond to the underlying labour market conditions, but wages growth is hardly rising at a pace that should be alarming, particularly with a strong response from the supply side that has seen the participation rate elevating to record highs coming out of the pandemic.


Next week's calendar includes the Q4 national accounts where GDP growth is expected to have expanded by around 0.7%, with the details covered in my preview here. That forecast factors in the partial indicators received this week including a 0.4% fall in construction activity (see here) and a 2.2% rise in business capex (see here). The capex survey was notable in that firms'forward-looking investment plans remained upbeat despite the uncertainty of the economic outlook and inflation that has made projects more expensive to undertake.   

Re-rating of growth prospects in Europe

After a resilient showing by the European economy over the winter, growth now looks to be picking up. A mild winter helped avoid what risked being an energy crisis, with energy prices falling substantially since mid-December. A rise on the composite PMI to a 52.3 reading in February (from 50.3) indicated activity was expanding at a 9-month high. Services activity accelerated to its fastest since June-22 (53.0); manufacturing output (50.4) returned to expansionary territory for the first time in 9 months on eased supply chain pressures allowing backlogged orders to be filled. 

Source: S&P Global 

This was also contributing to an easing in input cost pressures in the sector. However, in the services sector, costs were continuing to rise, in part reflecting higher wage costs. Services inflation remains under close monitoring by the ECB, which in January was running at 4.4% and is a key reason why core inflation is up at record highs (5.3%yr). Headline inflation has, however, fallen back to 8.6% from 9.2%. 

Thursday, February 23, 2023

Preview: Australian Q4 GDP

The ABS is scheduled to publish Australia's national accounts for the December quarter today at 11:30am (AEDT). Estimates indicate the Australian economy expanded by around 0.8% in the quarter and 2.7% through the year.   


Offshore, the economic backdrop remained a challenging one into year-end. Inflation was still printing at elevated rates, though it was likely past the peaks following falls in energy and goods prices. Growth had been resilient throughout much of 2022 to headwinds from cost-of-living pressures, rising interest rates and weak sentiment but had slowed further in many economies in the final quarter of the year. The return of Covid restrictions hampered growth in China. 


In Australia, with headline inflation picking up to its highest since 1990 at 7.8% over the year to Q4, the RBA continued to hike rates. Rising cost-of-living pressures and rate hikes weighed heavily on consumer sentiment, which fell back to the lows at the outset of the pandemic.


While household spending has slowed, it was still broadly resilient as incomes were being supported by a very strong labour market. Strong employment growth in the quarter drove the unemployment rate down to 3.4%, its lowest since the 1970s, while a broader measure of underutilisation in the labour market declined to a 40-year low. 


Under the weight of rising prices and with consumption rotating back to services, retail volumes contracted (-0.2%) in the quarter. However, retail sales had risen strongly in November as households brought forward their Christmas spending to take advantage of Black Friday discounting. Spending on services remained solid, continuing to be supported by the post-pandemic reopening of the sector. 


The RBA's tightening cycle was having a major effect on the housing market. Housing prices nationwide were down by around 9% from their peak in April 2022; the Sydney market driving the correction where the peak-to-trough fall has been around 14%. Residential construction was rebounding from a disrupted first half in 2022, though capacity constraints were still contributing to lengthy building times. 


Services trade remained robust responding to the reopening of the international borders earlier in the year. A rising inflow of tourists and students into Australia was boosting export earnings, while overseas travel and related spending had driven a very strong rebound in imports. National income continued to be supported by elevated commodity prices, though they had declined from their peaks in the middle of the year.  


As it stands | National Accounts — GDP

In the September quarter, the Australian economy expanded by 0.6% as growth over the year lifted from 3.2% to 5.9%. Real GDP was now more than 6% above its pre-pandemic level at the end of 2019.      


The ongoing rebound in services spending from the pandemic supported a solid rise in household consumption (1.1%), driving overall economic growth in the quarter. Spending patterns were continuing to rotate from goods (0.3%) to services (1.7%) as the effects of the pandemic were dissipating, led by discretionary services in tourism, hospitality and entertainment. Consumption continued to be robust despite household real incomes falling over the past year due to cost-of-living pressures. As a result, there was a further reduction in the household saving ratio in Q3 to 6.9%, falling from 12.9% at the end of 2021. 


An easing of materials and labour shortages in the construction sector and fewer weather-related disruptions in Q3 supported a rebound in home building and non-residential construction activity. Imports continued to rise reflecting strong domestic demand conditions, the rebound in overseas travel and the gradual resolution of pressures that have hampered global supply chains. Inventory rebuilding had occured alongside this, adding strongly to growth over the past year. 

Exports still remained below their pre-pandemic level but had picked up over the past two quarters as the volume of international tourists and students arriving in Australia continued to recover. Commodity prices declined from their highs earlier in the year but still remained at elevated levels. This saw the terms of trade easing from record highs in Q3. 


Key dynamics in Q4 | National Accounts — GDP 

Household consumption — Remained resilient to the headwinds faced by households from falling real incomes and weak sentiment as the post-Covid rebound in services spending continued. Retail sales contracted in the quarter, though demand was very robust over the Black Friday sales period.   

Dwelling investment — Private sector home building advanced further in the quarter, rebounding from weather-related and supply constraints in the first half of the year. Alterations continued to decline as the large pipeline of renovations was being worked through. 

Business investment — Non-residential construction appears to have rebounded in the second half of 2022 as delays caused by adverse weather and capacity constraints eased up. However, equipment spending slowed compared to the first half of the year. 

Public demand — Was little more than flat in Q4 rising by 0.3%. Government spending advanced (0.6%) but investment declined (-1%). 

Inventories — Weighed on activity in the quarter as inventory levels declined following a strong rebuild over the past year coming out of the pandemic.

Net exports — Set to contribute 1.1ppts to quarterly GDP. Export volumes lifted by 1.1% on the back of the post-pandemic recovery in services. Imports fell by 4.3% indicating domestic demand conditions may have softened.

Wednesday, February 22, 2023

Australian Capex 2.2% in Q4; 2022/23 investment plans $159bn

Australian private sector capital expenditure was stronger than expected rising by 2.2% in the December quarter. Buildings and structures spending picked up over the second half of the year as equipment investment slowed. Firms' forward-looking investment plans were upgraded and remain upbeat.  

CapEx — Q4 | By the numbers
  • Private sector capex increased by 2.2% in the December quarter, double the expected rise (1.1%), after a 0.6% gain in Q3 (upwardly revised from -0.9%). Year-ended growth lifted from 2.5% to 3.6%.  
  • Equipment, plant and machinery capex expanded by 0.6% in the quarter, partially rebounding from a 1.2% fall in the previous quarter, lifting growth through the year from 2.2% to 3.4%. 
  • Buildings and structures capex advanced by 3.6% quarter-on-quarter to be up by 3.8% over the year.  


  • Firms' 5th estimate of capex plans for 2022/23 was $158.7bn, an upgrade of 2.2% on the previous estimate put forward 3 months ago. This implies capex is on track to rise to its highest level in 8 years and increase by 12.6% compared to the previous financial year.     
  • Year-ahead investment plans for 2023/24 were nominated at $129.7bn, the highest figure put forward for a 1st estimate since 2014/15, also up 11.1% from a year ago. 


CapEx — Q4 | The details

In the December quarter, firms' capex (in real terms) increased by 2.2%, rising overall by 2.8% over the back half of the year. This compares with a subdued first half (0.8%). Whereas in the first half of the year, equipment spending was the driving factor for capex, buildings and structures took up the running in the second half, likely improving as weather and supply-related disruptions eased. In the most recent quarter, the spend on buildings and structures expanded by 3.6% while equipment spending lifted modestly by 0.6%.  


The rise in Q4 capex was led by the non-mining sector (2.8%), with gains in both buildings and structures (3.9%) and equipment (1.8%). Mining sector capex also increased (0.7%) as buildings and structures (3.1%) more than offset weakness in equipment (-5.2%). However, it remains around the subdued levels of recent years, failing to fire alongside the run-up in commodity prices that accompanied the global recovery from Covid.    


Firms' investment plans remain upbeat despite uncertainty over the economic outlook and cost pressures. According to business surveys, capacity constraints also remain a headwind, even if the remedy partly requires a boost in investment. 

For 2022/23, investment plans have been increased to around $160bn, representing a 2.2% rise over the past 3 months, which is a touch stronger than the historical average rise from estimates 4 to 5. It also implies a year-to-year rise of 12.6%, putting capex on track for its strongest year since 2014/15, though the increase is boosted by inflationary effects. 

Non-mining sector investment plans were lifted by 3.2% to $112bn, driven by a 7.9% upgrade to equipment spending plans ($57.2bn) as buildings and structures plans were revised 1.2% lower ($54.8bn). Mining sector investment plans for 2022/23 were left broadly flat overall at $46.6bn.   


At first blush, firms gave an upbeat estimate for capex in the year ahead in 2023/24 at around $130bn, a 9-year high for estimate 1 and 11.1% higher than indicated for 2022/23. Non-mining sector plans came in at $88bn (up 12.9% year to year) and mining plans were $41bn (+7.4%). 


CapEx — Q4 | Insights

Capex was solid in the December quarter. Yesterday's construction data, though, reported a weak quarter for non-residential building activity. But the theme over the second half of the year appears to be that non-residential construction improved as weather disruptions faded and supply pressures eased a bit. Equipment spending looks to have pretty moderate implications for growth in Q4. Investment plans remain upbeat, though their strength is boosted by inflationary effects on equipment and building costs. 

Preview: CapEx Q4

Australia's December quarter capital expenditure survey is due for release at 11:30am (AEDT) this morning. Today's report will provide a partial estimate of business investment ahead of next week's Q4 national accounts. Capex lost momentum over 2022 but is expected to see a rebound with a modest rise in the December quarter. Forward-looking investment plans may remain upbeat but uncertainty over the economic outlook poses risks.    

As it stands Capital Expenditure

Since rebounding to pre-pandemic levels in mid-2021, capex has levelled out and posted a weak result in the September quarter (-0.9%). Over the past year, capex lifted by 1.7%.


In the September quarter, spending on buildings and structures increased by 0.5% (1.4%Y/Y), rebounding from supply and weather-related disruptions in previous quarters; however, equipment spending fell by 1.6% (2.2%Y/Y).    

Relative to their respective pre-pandemic levels, equipment spending (6.9%) is substantially more elevated than buildings and structures (0.6%), due in part to tax incentives for the acquisition of new assets in addition to accommodative financing conditions. 


Capex in the non-mining sector increased by 1.4% in the quarter to be up 1.2% on pre-pandemic levels, with equipment spending the driver (6.7%). Mining sector capex declined by 5.1% for the quarter to remain around the subdued levels of recent years.

Forward-looking capex intentions for 2022/23 were increased to their highest level in 8 years. Estimate 4 was upgraded by 5.6% to $156bn, implying capex was on track to rise by around 12% on the previous financial year. The implied year-to-year rise in non-mining capex was 12.9% and 11% in the mining sector.   


Market expectations Capital Expenditure

Capex is expected to have risen by 1.3% in the December quarter, with estimates in the Bloomberg survey ranging from -3% to 4%. Today's survey will also include the 5th estimate of capex plans for 2022/23 and the 1st estimate for the 2023/24 financial year. For estimate 5, a modest upgrade in capex plans to around $160bn looks likely, based on the average increase on estimate 4 over the history of the series. Investment plans for 2023/24 could potentially see an upgrade of around 5-10% from the previous year to $123-$128bn, albeit with a large degree of uncertainty. 

What to watch Capital Expenditure

Much of the focus will be on the forward-looking capex plans and whether the upbeat outlook from firms still remains intact. The pandemic led to a period of deferred investment, with firms then left playing catch up due to the strength of the economic recovery. But the year ahead brings uncertainty with expectations for the global and domestic economies to slow while inflation is anticipated to take time to come down from its elevated pace.       

Australian construction activity -0.4% in Q4

Australian construction activity was weaker than expected in the December quarter as supply constraints remain a headwind, holding back the pace at which the sector can work through elevated pipelines. Cost pressures continue to remain high but are trending lower. 

Construction Work Done — Q4 | By the numbers
  • Construction activity declined by 0.4% in the December quarter, a downside surprise on market expectations for a 1.5% rise. Work done in Q3 was revised to show a larger rise of 3.7% from 2.2% in the initial report. In year-ended terms, construction work advanced by a modest 1%.    
  • Segment details were;
    • Engineering work expanded by 1%q/q (from 4.7% in Q3) to 4.3%Y/Y 
    • Building work declined by 1.6% (following a 3% rise) to be down by 1.4% through the year.
      • Residential work lifted by 0.9% (from a 2.1% rise in Q3) but still contracted by 1.8% over the year.  
      • Non-residential work pulled back sharply by 5.1% in the quarter, which saw annual growth fall from 7% to -0.8%. 


Construction Work Done — Q4 | The details 

Construction activity appeared to stall in the December quarter (-0.4%) following a strong September quarter (3.7%) in which adverse weather and supply-related disruptions eased. This left activity 3.3% higher over the back half of the year, a strong rebound from a 2.2% contraction in the first half. 


In the most recent quarter, the weakness was driven by non-residential construction (-5.1%), with broadly offsetting gains coming through in the residential segment (0.9%) and in engineering work (1%). 
 

Looking more closely into the details, there were positive developments in private sector home building, with activity expanded by a further 2% after a 3.4% rise in Q3. This effectively reversed the contraction in work done over the first half of the year (-5.5%) when the sector was severely hampered by an extended La Nina event, shortages of labour and materials and rising cost pressures. Meanwhile, alteration work (-5.1%q/q) continues to unwind as more of the renovations undertaken in response to the HomeBuilder stimulus are completed.  
 

Engineering work was a positive overall (1%), though there was a divergence between activity in the public (3.5%) and private sector (-0.8%). The former is being supported by a large pipeline of infrastructure projects across the nation, with many state governments ramping up investment as a stimulus response coming out of the pandemic. 


The main area of weakness was private sector non-residential construction, which slumped by 7.5% in the quarter, its largest fall since 2016. However, this was after a surge in activity in the previous quarter (5.6%). Overall, work in the segment fell in both the first (-0.7%) and second half (-2.3%) of 2022, suggesting that capacity constraints remain a headwind.  


Construction Work Done — Q4 | Insights

Supply constraints that have affected the construction sector look to have eased from the first half of the year but still remain a headwind. Inflation in the sector remains elevated but has likely peaked given the downward trend observable in the quarterly rate (see chart below). Based on today's report, residential construction looks likely to have relatively neutral implications for Q4 GDP growth, though non-residential construction will be a clear negative.