Independent Australian and global macro analysis

Sunday, September 8, 2019

Australian housing finance approvals on the rise

Australian housing finance approvals lifted sharply in July consistent with the signals from recent activity data that have indicated conditions in the housing market started to improve following May's federal election, supported also by RBA rate cuts and an easing in macroprudential policy.

Housing Finance — July | By the numbers
  • Housing finance approvals to owner-occupiers (excluding refinancing) increased by 4.2% in July to 32,427 to easily surpass the market's forecast for a 1.5% rise (prior rev: +0.6% from +0.4%). Approvals are down by 8.7% on a year earlier (prior rev -13.5% from -13.6%). 
  • The total value of housing finance commitments (excluding refinancing) surged by 5.1% in the month to $A17.896bn (prior rev: +3.2% from +1.9%), with the annual decline cut from -17.2% to -11.8%.


Housing Finance — July | The details 

In aggregate, the total value of lending commitments excluding refinancing lifted by 5.1% in July to $17.896bn. This was its strongest monthly rise in more than 4 years going back to March 2015. The annual decline fell from -17.2% to -11.8% to be at its slowest since July last year. 

Across the segments, lending to owner-occupiers (ex-refinancing) posted a 5.3% rise in the month, its strongest monthly increase since August 2015, to $13.253bn, with the annual decline contracting from -14.4% to -8.3%. The investor segment saw a 4.7% rise in July, its highest month-on-month gain since September 2016, to $4.643bn, which saw the annual decline ease from -24.4% to -20.4%. The value of approvals made for alterations to existing owner-occupied properties fell by 2.7% in July to $270.4m to be down by 9.4% over the year. 

In total, refinancing commitments increased by 5.5% month-on-month, its fastest monthly rise since February 2014, to $8.577bn but is down by 4.8% compared to a year earlier. Refinancing to owner-occupiers jumped by 6.3% in the month to $6.07bn (-5.2%Y/Y), while investor refinancing lifted by 3.5% to $2.508bn (-3.7%Y/Y). 

    
In terms of loan approvals to owner-occupiers, the total level excluding refinancing was up by 4.2% in July, its strongest month-to-month gain since June 2015, to 32,427. This cut the annual decline from -13.5% to -8.7%. Approvals to purchase existing properties jumped by 4.9% to 24,866 (-7.2%Y/Y). Construction-related approvals lifted by their most in a year with a 2.0% rise in July that kept the annual decline at -13.2%. This was all due to a 10.7% surge in approvals to purchase newly constructed dwellings (includes those off the plan), which are now down by 9.8% over the year compared to -22.7% last month. Approvals to fund new construction declined by 1.6% in July (-14.6%Y/Y). The ABS does not produce approval estimates for the investor segment.    


July's state-based details for all borrower types and segments are shown in the table, below. Owner-occupier approvals lifted noticeably in all mainland states in July. Meanwhile, lending commitments to investors increased in every state in the month; the last time this occurred was back in December 2016.  


Housing Finance — July | Insights 

There were early signs in this report of demand for housing finance responding to the passage of the federal election, the easing in APRA's guidance around credit assessment standards, interest rate cuts from the Reserve Bank of Australia in June and July (with further easing also possible) and rising buyer sentiment. Based on the recent flow of activity data for prices and auction clearances, further gains in housing finance approvals appear likely in the months ahead. 

Friday, September 6, 2019

Macro (Re)view (6/9) | Australian GDP growth slows further in Q2

Highlighting this week's developments, the National Accounts confirmed the Australian economy lost further momentum in the June quarter. GDP growth was in line with expectations at 0.5% in Q2 and 1.4% for the year, the latter slowing from 1.8% to be at its weakest since the post-GFC period. The key dynamic was the widening differential between private and public sector demand, with activity in the quarter bolstered by a strong contribution from net exports (see our full review here). 

Private sector demand contracted by 0.1% in Q2 turning the annual pace from +0.4% to -0.3% to its weakest rate since the onset of the GFC a decade ago. This reflects slowing growth in household consumption, as well as weakness in residential construction and business investment. For households, consumption growth  in annual terms has slowed to a 6-year low at 1.4% against the headwinds from low income growth, the downturn in the housing market and a clear weakening in sentiment over the first half of the year compared to the second half of 2018. The deterioration in the residential construction cycle continues to gather pace, with activity contracting by 4.4% in Q2 to be down by 9.1% through the year  its sharpest rate of decline in 7 years. Business investment was also soft falling by 0.4% in Q2 and 1.6% year-on-year, impacted by the wind down of major projects in the resources sector and by uncertainty around global economic conditions and over the direction of domestic policy in the lead up to May's federal election. In contrast, public demand remains robust, rising by 1.5% in Q2 and by 5.2% over the year, with support coming from spending on healthcare initiatives and infrastructure investment. Our chart of the week (below) highlights the divide between private and public sector demand over the past year. Despite tensions between the US and China weighing notably on global trade flows, the same cannot be said for Australia given that net exports added a sizeable 0.6ppt to activity in Q2 and 1.2ppts over the past year. In addition, surging commodity prices boosted national income by 1.2% in Q2 and 5.4% over the year to power the nation to its first current account surplus since 1975 (see here). 

Chart of the week

At its 1.4% annual pace, GDP growth was below the 1.7% pace forecast by the Reserve of Australia in August's quarterly statement. However, with the RBA's latest policy meeting taking place the day before Q2's National Accounts were released, the Board held the cash rate steady at 1.0% this week (reviewed here). The key theme from the governor's decision statement was that while labour market conditions remain crucial to the policy outlook, the Board's immediate focus appears to have broadened, likely reflecting the intensifying headwinds from abroad due to trade and geopolitical tensions and uncertainty around its domestic economic outlook. The Bank is reasonably constructive on the outlook for the second half, due in part to an expected lift in household consumption supported by its earlier rate cuts, the federal government's tax cuts and improving housing market conditions. Data from CoreLogic this week showed that national property prices lifted by 0.8% in August  its first monthly rise since October 2017  while capital city prices were up by a stronger 1.0%. However, against this, retail sales data this week showed spending declined by 0.1% in July with clear weakness in the discretionary areas (see here). With income growth likely to remain subdued, another headwind came from a sharp fall in the household saving ratio over Q2 to 2.3%, which is its lowest level since Q4 2007. 


— — 


To events from offshore, the increased optimism around trade developments continued this week as the US and China agreed to meet next month in Washington. Negotiations between the sides had stalled after a meeting back in July failed to achieve progress in reaching a deal, prompting US President Trump to announce a new round of tariffs on consumer-related imports, to which China responded by implementing tariffs on US agricultural products and vehicles. However, there was no indication by either side that these most recent tariffs would be rescinded or delayed.

The impact of tariffs and uncertainty over trade policy more generally has been a major headwind to the manufacturing sector across the globe driving a sharp slowdown in activity over 2018 before falling into contraction this year. According to JP Morgan's Global Manufacturing PMI, activity contracted for the 4th consecutive month in August at a reading of 49.5. The underlying details showed new orders and export volumes had contracted at their sharpest rates in around 7 years in July, while sentiment in the sector had also fallen to its weakest since 2012. At the country level, US manufacturing slipped into contraction in August for the first time since 2016 based on the closely-followed ISM index, which printed at a weaker-than-expected 49.1 in August. Notably, every sub-component of the index is now declining, as new orders and output deteriorated to multi-year lows. In the euro area, the sector remains firmly in contraction with IHS Markit's manufacturing PMI at 47.0 in August  just off its weakest reading in 6½ years. Conditions in Germany, the bloc's largest economy, are currently at their weakest in nearly 7 years with firms cutting back sharply on employment in response to a deterioration in demand from clients that are unwilling to commit to orders given that investment plans have been scaled back in the face of an uncertain global economic outlook. 

In contrast to the decoration in manufacturing, the global services sector has remained resilient, though conditions now appear to be easing. The JP Morgan Global Services Business Activity Index declined to its lowest level in 3 months in August at 51.8, though it is still in expansion. With output growth slowing, the internals of the report highlighted an easing in new business orders and employment. This was due largely to a sharp slowdown in activity in the US services sector, with output falling from 53.0 to 50.7 in August, indicating that growth has slowed to its softest pace since early 2016. It is becoming increasingly clear that trade and economic uncertainty are a strengthening headwind for the sector as confidence among services firms fell to a new record low. The euro area's services sector is, by contrast, remaining more resilient, with activity firming from 53.2 to 53.5 in August — its 73rd consecutive month of expansion. The result for August was supported by an increase in new work orders, while backlogs also came down. However, there are justifiable causes for concern that the deterioration in manufacturing may be starting to cross over into the services sector, with employment growth slowing to its softest pace since the turn of the year, while confidence in the outlook over the next 12 months fell to its weakest in 6 years.

The week's main highlight from offshore was Friday's US non-farm payrolls (employment) report for August, which contained mixed details. Employment increased by 130k in the month, including a 25k boost of temporary workers for next year's census, which was well below the 160k expected by markets. However, the unemployment rate matched expectations, remaining at 3.7%, despite workforce participation lifting from 63.0% to 63.2%. Meanwhile, growth in average hourly earnings surprised to the upside at 0.4% in the month (expected 0.3%) and 3.2% over the year (expected 3.0%), and average weekly hours per employee lifted slightly to 34.4 hours. Given these mixed details, a definitive assessment of the labour market is difficult to form, which is a good illustration of why there is such a divergence of views by FOMC members around the appropriate policy stance ahead of the Federal Reserve's policy meeting in two weeks' time. Just this week, St Louis Fed President James Bullard outlined the case for a 50 basis point cut, while others such as the Boston Fed's President Eric Rosengren have argued for rates to be left on hold for the time being. Remarks on Friday from Federal Reserve Chair Jerome Powell were consistent with his recent commentary, outlining that the Committee anticipates a broadly constructive outlook for the US economy, though it is mindful of the "significant risks" posed by trade and geopolitical developments and will "... continue to act as appropriate to sustain this expansion". Following these comments, financial markets firmed expectations for a 25 basis point cut to be delivered at the September meeting. 


Ahead of next week's European Central Bank meeting, divergence is also evident within the Governing Council. At what will be President Mario Draghi's penultimate meeting in charge, markets broadly expect a package of stimulatory measures to be announced, likely including a rate cut and quantitative easing. Most of the conjecture has been around the latter, with an increasing number of members publicly stating their reticence to re-starting quantitive easing, though the Governing Council's doves are likely to win out.   


Thursday, September 5, 2019

In review: Australian Q2 GDP growth 1.4%; private demand weak

Following a sharp loss of momentum in the second half of 2018, the Australian economy eased further over the first half of 2019. On a seasonally adjusted basis, real GDP growth was 0.5% in the June quarter, printing in line with the consensus forecast, while the annual pace slowed from 1.8% to 1.4% its slowest since Q3 2009 to around half the nation's trend rate of output growth. 


Uncertainty was a key theme in the June quarter, with headwinds from offshore intensifying due to a deteriorating global economic outlook that is driven by a slowdown in manufacturing in response to escalating US-China trade disputes and geopolitical tensions in Europe. Domestically, uncertainty over government policy was prevalent in the lead up to May's federal election, while the Reserve Bank of Australia (RBA) recommenced its easing cycle by lowering the cash rate for the first time since 2016 due to softening labour market conditions and below-target inflation. 

In the June quarter, the key dynamic in the domestic economy was the contrast in private and public sector demand. Demand in the private sector contracted by 0.1% in Q2 to be down by 0.3% over the year — its weakest since the GFC — which has been weighed by slowing household consumption in response to low income growth and weak housing market conditions, a downturn in residential construction activity and soft business investment. However, robust growth in public demand remains in train rising by 1.5% in Q2 and by 5.2% through the year, supported by healthcare spending and infrastructure investment.


— — 

GDP — Q2 | Expenditure: GDP (E) +0.4%q/q, +1.5%Y/Y

Household consumption (+0.4%q/q, +1.4%Y/Y) — Growth in household consumption was 0.4% in Q2, with the annual pace slowing to a 6-year low at 1.4%. Consumption spending has been soft for 4 consecutive quarters with the profile being; 0.3% (Q3 '18), 0.4% (Q4 '18), 0.3% (Q1 '19) and 0.4% (Q2 '19). *(click on the charts to expand)


The detailed breakdown of spending was fairly even in Q2, with discretionary up by 0.3% compared to a 0.4% lift from non-discretionary, though over the past year discretionary spending at 0.6% lags well behind growth in non-discretionary at 1.9%. Notable in Q2 were sizeable declines in spending on vehicles (-3.0%), tobacco (-0.9%) and utilities (-0.8%), while the increases were led by cafes and restaurants (+0.9%) and clothing and footwear (+0.7%).


Slow income growth remains an enduring headwind for the household sector, which reflects a labour market with an elevated level of spare capacity as well as weakness in productivity. Real growth in household disposable income declined by 0.3% in Q2 with the annual pace slowing from 1.0% to 0.5%. Given that real spending was up by 0.4% in the quarter against a decline in income, this led to a fall in the household saving ratio from 3.0% to 2.3% to be at its lowest since Q4 2007. This points to risks that the stimulatory impact from the RBA's June and July rate cuts and the increased tax offset for low-and middle-income earners may be dampened by households looking to lift saving by lowering consumption.  


Dwelling investment (-4.4%q/q, -9.1%Y/Y)  The downturn in the residential construction cycle intensified with activity declining by 4.4% in Q2 — its weakest quarter in 6 years — and by -9.1% over the year, which is its sharpest rate of contraction in 7 years. Activity in new dwelling construction fell to its weakest since the GST-induced slowdown back in 2000, with a 5.9% contraction in Q2 to be down by 10.9% across the year. Alteration work fell by 1.4% in Q2 — its third consecutive quarterly decline — and has fallen by 5.6% in annual terms. Overall, the weakness in residential construction activity reflects the sharp deterioration in dwelling approvals over the past year, with the pipeline of work to be done now coming down in most states.     


Business investment (-0.4%q/q, -1.6%Y/Y) — Underlying business investment was weak over the first half of 2019, with a 0.4% contraction in Q2 after a flat Q1, while the 1.6% annual decline was unchanged from Q1. Uncertainty over the global economic outlook and the policy framework in the lead up to the Australian federal election in May appear to have been significant headwinds for firms. The 0.4% decline in Q2 was centred on weakness in non-dwelling construction, with spending on new buildings (-5.0%q/q, -3.8%Y/Y) and engineering (-4.7%q/q, -14.8%Y/Y), the latter indicative of the nearing completion of major projects in the resources sector. The detail was much more constructive elsewhere in Q2; equipment and machinery +3.2% (+5.2%Y/Y), intellectual property products +2.9% (+7.3%Y/Y) and cultivated biological resources +4.1% (-9.0%Y/Y). The ABS's recent capital expenditure survey pointed to rising investment intentions from both the non-mining and mining sectors in 2019/20, though caution around this outlook appears warranted.  


Public demand (+1.5%q/q, +5.2%Y/Y) — Strong growth in public demand continues and has been the leading contributor to activity over the past year. This has been supported by spending on health and aged care services and infrastructure investment for transport and electricity-related projects. However, the profile in Q2 was mixed with consumption spending up by 2.7% and underlying investment down by 3.2%.


Net exports  (+0.6ppt in Q2, +1.2ppt yr) — At 0.6ppt in Q2, net exports made their strongest contribution to growth since the March quarter of 2018, and follows on from a 0.4ppt contribution in Q1. Export volumes lifted by 1.4% in Q2, with broad-based support from resources, after a 1.9% rise in Q1. Meanwhile, import volumes declined by 1.3% in Q2 after a soft outcome of -0.2% in Q1, which reflects weak domestic demand conditions and a lower Australian dollar.    


Inventories (-0.5ppt in Q2, -0.7ppt yr) — Inventories subtracted 0.5ppt from growth in Q2, with weakness spread across mining, manufacturing, wholesalers, retail and accommodation and food services.     

— — 

GDP — Q2 | Incomes: GDP (I) +0.6%q/q, +1.4%Y/Y

The real GDP income estimate lifted by 0.6% in the June quarter, which was stronger than both the expenditure and production estimates, while the annual pace remained at its equal lowest since Q3 2009 at 1.4%. 


In nominal terms, Australian GDP growth was 1.2% in Q2 to be up by 5.4% through the year. Growth has been robust in each of the past 6 quarters and has driven the annual pace off its recent low of 3.8% in Q4 2017. The key dynamic has been escalating commodity prices and this has generated a tailwind for national income. The terms of trade increased by a further 1.5% in the June quarter, though this was much lower than the increases of 3.0% and 3.1% in the previous two quarters. In year-on-year terms, growth in the terms of trade lifted from 6.0% to 8.9% — its fastest rate of expansion since Q3 2017. 


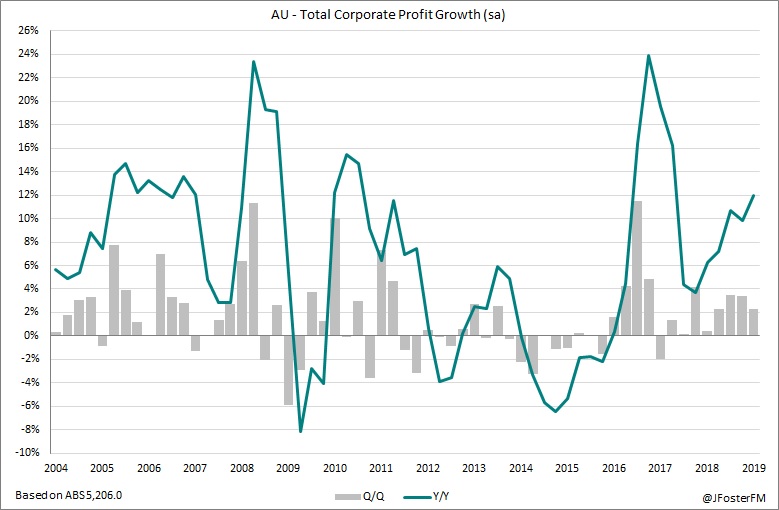
In aggregate, rising national income has provided a direct boost for the corporate sector, with private company profits (excluding financial corporations) up by 2.9% in Q2 and by 14.9% over the year. However, as one would expect, the main beneficiary of escalating commodity prices has been mining companies, while profits across the non-mining sector have been relatively subdued. Profits for financial corporations increased by 0.7% in Q2 — the softest quarterly rise since Q3 2016 — resulting in annual growth moderating from 7.3% to 6.6%. 


Income from wages and salaries as per the Compensation of Employees measure increased by 1.3% in the June quarter to match the rise from Q1. Growth over the year is now running at a 5.0% pace having picked up from 1.7% over the past 2½ years. There are two factors behind this; annual growth in hours worked has risen from 0.9% to 1.6% over this time, while growth in employment has been robust lifting from 1.1% to 2.4% based on the ABS's Labour Force Survey. 


— — 

GDP — Q2 | Production: GDP (P) +0.5%q/q, +1.5%Y/Y

The production estimate for GDP in Q2 was 0.5%, which was in the middle of the expenditure (0.4%) and income (0.6%) estimates. The annual pace continues to slow, moving down from 1.8% to 1.5% to its weakest since Q3 2009.

There were 7 industries that weighed on output in Q2 compared to 4 in Q1. These industries were; agriculture (-2.1%), construction (-1.4%), manufacturing (-1.4%), wholesale trade (-1.4%), utilities (-0.3%), transport (-0.3%), and arts and recreation (-0.1%). Drought conditions continue to heavily impact output from the agriculture sector and the construction industry is weighed by weakness in residential and commercial building. 


The health sector led output over the past year at 7.9%, driven by public spending associated with the rollout of initiatives such as the NDIS and PBS and aged care services. Output in Q2 was strongest in the Mining sector (+3.4%) and second overall for the year at 6.2%, due largely to the ramp up in LNG production as completed projects come on line. The industry-by-industry breakdown for Q2 and for the year is shown in the chart, below.   


— — 

GDP — Q2 | Prices

The broadest measure of economy-wide inflation the GDP deflator — increased by 0.8% in Q2, which was the softest quarterly outcome since the 0.2% rise from a year earlier. Driven by a base effect, the annual pace lifted from 3.3% to 3.9% and has accelerated from a 1.9% pace from a year ago. This acceleration reflects the escalation in terms of trade over this timeframe. The Gross National Expenditure deflator adjusts for this impact and highlighted that pricing pressures remained subdued with a 0.4% rise in Q2, which slowed the annual pace from 1.9% to 1.7%. 


The widely-followed Consumer Price Index on a headline basis increased by 0.6% in the June quarter taking the annual pace from 1.2% to 1.6%. The household consumption deflator is the closest proxy to the CPI within the National Accounts, though it is based on dynamic consumer spending rather than the fixed basket methodology in the CPI, and this measure increased by 0.6% in Q2 lifting the pace over the year from 1.5% to 1.9%, which is its highest in 5 years. 

— — 

GDP — Q2 | Productivity

National productivity growth remains mired in a period of weakness and is a strong structural headwind for wages growth. However, there was a slight improvement this quarter. Growth in total hours worked in the quarter was 0.1% and was exceeded by output growth of 0.5%, thus real GDP per hour worked expanded by 0.4% in Q2 — its best result in 5 quarters. However, it remains in contraction over the year, though the rate of decline was cut from -1.2% to -0.2%. 


In the market sector, which excludes the public sector, GDP per hour worked was flat in Q2 after consecutive quarterly declines of 0.3%, while the annual pace remains very weak at -0.6% but improved marginally from -0.8%. On this basis, productivity remains at around an 8-year low. Real GDP per capita stalled in Q2 after rising by 0.1% in Q1 and followed contractions of  0.1% and 0.2% in the second half of 2018. In annual terms, real GDP per capita fell by 0.2% to be at its weakest since the GFC. 


Nominal non-farm unit labour costs were up by 1.3% in the June quarter, with a base effect seeing the annul pace accelerate from 1.9% to a near 8-year high of 3.5%. Adjusting for inflation, real non-farm unit labour costs were up by 0.6%, but after falls in the previous two quarters was down by 0.6% on a year earlier, notwithstanding an improvement from -1.7%. This continues to point to a soft inflationary pulse consistent with an elevated level of spare capacity in the labour market.


 — — 

GDP — Q2 | States

In New South Wales, demand stalled in Q2 while annual growth slowed from 1.8% to 1.3% to be at its softest since Q4 2013. The slowdown over much of the past year has been driven by a weakening in household consumption to 1.0% in annual terms from 3.1% a year ago. Although employment growth in the state was robust over the year at around 3.0%, the unemployment rate lifted slightly over the first half of 2019. The other major headwind has been the deterioration in residential construction, with activity having fallen by around 16% over the year reflecting completions and weak housing market conditions. There continues to be offset from robust public demand, as well as from business investment supported by non-dwelling construction, equipment and intellectual property.  


Demand in Victoria increased by 0.5% in Q2, though a base effect resulted in the annual pace slowing to 1.9% from 2.5%, which is its softest since Q3 2014. Annual growth in household consumption has slowed to a 6-year low at 1.9% in line with softening labour market conditions over the first half of the year. After a weak second half of 2018, the downturn in residential construction intensified over the first half of this year with declines in both construction and alterations. The public sector remains supportive of state demand, and despite a weak period over the last year, investment is likely to pick up given the pipeline of work to be done around infrastructure, which will have flow-on benefits for the private sector.

In the other states, demand in Queensland stalled in Q2 slowing the annual pace to just 0.4%. Household consumption continues to be subdued, though Q2 saw a decent rise of 0.7% to be up by 2.2% for the year. Business investment remains weak, particularly in the area of engineering construction. In South Australia, demand contracted by 0.2% in Q2 — as was the case in Q1 — with annual growth decelerating from 1.6% to 0.4%. The factors driving this slowdown have been weakening household consumption, a rollover in the residential construction cycle, and declining business investment. Demand in Western Australia lifted by 0.8% in Q2 — its strongest quarter since Q3 2017 — though it still remained down on a year earlier at -0.1% despite improving from -1.6%. The quarterly result was boosted by equipment spending, but household consumption is subdued and residential construction is in the midst of a sharp downturn. State demand in Tasmania was 0.3% in Q2, and while the annual pace slowed from 4.1% to 3.1% it remained the strongest in the nation. This has been boosted by public spending, which has helped to offset slowing household consumption, residential construction and business investment. 


Wednesday, September 4, 2019

Australia's trade surplus $7.3bn in July

Australia's monthly trade surplus in July came back from its record high in the previous month as spending on imports outpaced a modest rise in export earnings. Data earlier this week showed the trade surplus surged to its highest on record in Q2 driven by an escalation in commodity prices, which saw the nation post its first surplus on current account since 1975. In yesterday's National Accounts, net exports led activity in Q2 with a 0.6ppt contribution to headline GDP growth of 0.5%.  


International Trade — July | By the numbers
  • The trade surplus declined by $709m in July to $A7.268bn, though this was higher than the market's forecast for $7.0bn. June's trade surplus was revised down from $8.036bn to $7.977bn. 
  • Export earnings increased by 0.6% in the month (+$270m) to $A42.538bn, with annual growth rising from 15.3% to 15.9% (prior rev: +1.4%m/m, +15.3%Y/Y) 
  • Import expenditure rebounded by 2.9% in July (+$979m) to $A35.270bn coming off a 3.5% fall in June, which swung the annual pace from -1.5% to +0.9%.


International Trade — July | The details 

On the exports side, total earnings lifted only modestly in July by 0.6%, or by $270m in nominal $AUD terms. The breakdown showed this was driven by the volatile non-monetary gold component (+66%, $1.09bn). This was moderated mostly by a 3% decline (-$807m) in non-rural goods that was centred on weakness in commodities with; coal -$571m, metals -$415m and metal ores -$89m, with the ABS's estimates pointing to softness from prices and volumes. However, LNG was still going strongly with earnings up by $214m on strength in prices and volumes. Meanwhile, rural goods fell by 1% (-$42m) in the month. Services exports were little changed in July rising by $38m. 


For imports, the 2.9% rise equated to a nominal increase in expenditure of $979m, which also likely includes some pass-through from a weaker Australian dollar in 2019. The increases were across; intermediate goods (driven by higher oil prices) (+5%, $541m), consumption goods (mainly due to vehicles) (+4%, $378m), and non-monetary gold (+29%, $177m). Some offset came from capital goods (-1%, $87m) and services 0%, -$30m).    

  
International Trade — July | Insights 

This was another very strong monthly trade surplus to start Q3 and was around $1.0bn above the average from Q2. However, the recent retracement in commodity prices is expected to see trade surpluses moderate in the months ahead, as well as the impact of a weaker dollar lifting import prices. From a voulme perspective, resources exports are expected to add notably to economic activity over the second half of 2019.        

Tuesday, September 3, 2019

Australian Q2 GDP growth 0.5%; 1.4%Y/Y

Momentum continues to slow in the Australian economy as real GDP growth on a seasonally adjusted basis printed in line the consensus forecast at 0.5% in the June quarter, which resulted in the annual pace slowing from 1.8% to 1.4%, as expected, to its weakest since Q3 2009. Output growth at 1.4% year-on-year was well below the Reserve Bank of Australia's (RBA) forecast for 1.7% and is roughly half the nation's trend or potential growth rate. 

Activity expanded by an annualised pace of around 1.0% over the first half of 2019 in which uncertainty was a major headwind, not only from offshore due to rising US-China trade tensions, geopolitical factors and financial market volatility but also at home in the lead up to May's federal election given the potential for changes to government policy. The RBA anticipates activity to strength over the second half, due mainly to the stimulatory boost from its cash rate cuts in June and July and the federal government's tax relief for low-and middle-income earners, though there are clear downside risks for its forecast for growth of 2.4% by year's end.       


The key dynamic in the Australian economy is that there continues to be a stark divide between private and public sector demand. Private sector demand contracted by 0.1% in the quarter to be -0.3% over the year -- its weakest pace in nearly a decade. In the public sector, underlying growth in demand lifted by a solid 1.4% in Q2 to be tracking at a 5.5% pace through the year, with support from healthcare spending and infrastructure investment.  


Weakness in private sector demand can be attributed to slowing growth in household consumption, the downturn in residential construction and weakness in business investment. The chart, below, highlights that activity in Q2 was driven mostly by public demand and net exports.   


Household consumption growth was 0.4% in Q2, a slight improvement from Q1's outturn of 0.3%, though the annual pace slowed from 1.8% to 1.4%, which is a 6-year low. Household disposable income in real terms declined by 0.3% this quarter to be just 0.5% higher over the year. The RBA has clearly articulated the headwinds to income growth from spare capacity in the labour market, though there are also challenging structural factors at play due to weakness in productivity. The squeeze from low income growth remains evident with the household saving ratio falling by 0.7ppt to 2.3% -- its lowest since Q4 2007. Household consumption continues to be driven by essential goods and services at 1.9% over the year, which compares to just a 0.6% pace for discretionary spending -- its lowest since Q1 2013. 

The downturn in the residential construction cycle gathered pace in Q2, with private sector activity on aggregate falling by 4.4% in the quarter to be down by 9.1% across the year. The details showed new home building contracting by 5.9% in the quarter (-10.9%Y/Y) and alterations -1.4% (-5.6%Y/Y).   

Business investment was weak on net falling by 0.4% in Q2 and by -1.6% over the year. However, this was weighed entirely by a 4.8% fall in non-dwelling construction in the quarter, with equipment spending (+3.2%q/q), intellectual property products (+2.9%q/q) and cultivated biological resources (+4.1%q/q) all rising. The ABS's recent Capital Expenditure survey was broadly constructive for investment plans in the 2019/20 financial year, though the headwinds from global and domestic economic conditions warrant caution. 

Public demand contributed notably to output growth in the quarter, driven by government spending on healthcare initiatives such as the NDIS and PBS. Investment declined in the quarter, however there is a robust pipeline of infrastructure projects to work through and this will support activity over the medium to long term.   

Net exports added a sizeable 0.6ppt to activity in Q2 -- its strongest contribution since Q1 2018. Export volumes lifted by 1.4% in the quarter with broad-based support from the resources sector, while imports contracted by a sharp 1.3% underscoring the weakness in private sector demand and a lower Australian dollar. Meanwhile, inventories subtracted 0.5ppt from GDP growth in the quarter.

Link to our full review here

RBA on hold in September

The Reserve Bank of Australia (RBA) Board held the cash rate steady at 1.0% at its September policy meeting in Sydney today, as widely expected by markets and economists. The cash rate has been kept steady for two straight meetings now following rate cuts of 25 basis points in June and July. 


Today's decision statement from Governor Philip Lowe commenced by indicating slightly more concern around global economic conditions, in particular that the risks to the growth outlook "are tilted to the downside" because US-China trade tensions "are affecting international trade flows and investment as businesses scale back spending plans due to the increased uncertainty". This is consistent with the general deterioration in the data flow from offshore recently. As such, the RBA continued to highlight that, with growth outlooks facing major headwinds and given subdued inflationary pressures, other central banks are expected to ease policy rates. 

Ahead of tommorow's National Accounts for Q2, the Bank appears to acknowledge that its forecast for GDP growth of 1.7% in annual terms will not be achieved. Though, the statement then goes on to say that a gradual strengthening is then expected "to around trend over the next couple of years". Factors cited as justifying this outlook include; support from recent rate cuts, tax relief, infrastructure investment, a more buoyant resources sector and stabilising housing market conditions, particularly in Sydney and Melbourne.

Since August's meeting the main developments domestically were updates on the labour market and wages growth. On the labour market, the governor continued to highlight strong employment growth and record-high participation in the workforce, though the unemployment rate had "remained steady at 5.2% over recent months". There was no change in the assessment of wages growth, noting that it "remains subdued and there is little upward pressure at present, with strong labour demand being met by more supply". With that being the case, the governor hinted at a softer inflation outlook; "inflation pressures remain subdued and this is likely to be the case for some time yet", although the description of its existing forecasts was retained in the statement.

A slight broadening was made to the final line to now read; "The Board will continue to monitor developments, including in the labour market, and ease policy further if needed to support sustainable growth in the economy and the achievement of the inflation target over time".

Overall, the Board appears to remain in wait-and-see mode following its recent rate cuts. Labour market developments still remain very important, though they are not the only consideration for policy given the headwinds from the global economy and a domestic growth outlook that looks likely to come under pressure. Markets have priced in the next rate cut being delivered at the November meeting.    

Australian retail sales -0.1% in July

Australian retail spending made a weak start to Q3 after falling by 0.1% in July. This comes after a soft Q2 in which sales volumes lifted by just 0.2% in the quarter and also 0.2% over the year — its weakest annual pace since 1991. 

Retail Sales — July | By the numbers
  • Growth in retail turnover on a seasonally adjusted basis fell by 0.1% in July to $A27.411bn, which was against expectations for a rise of 0.2%. Turnover lifted by 0.4% in June. 
  • Over the year to July, retail spending increased by 2.4% moderating from a 2.5% pace in June.
  • In trend terms, retail sales increased by 0.1% in the month, though the annual pace slowed from 2.6% to 2.4% — its softest since December 2017. 

Retail Sales — July | The details 

In July, weakness was notable in the discretionary areas of spending. Looking across the board, spending increased in only two categories in the month, with food up by 0.3% (+3.2%Y/Y) and household goods ticking up by 0.1% (+0.6%Y/Y). Spending in all other areas declined in July; clothing, footwear and personal accessories -1.0% (+3.2%Y/Y), department stores -0.2% (+0.6%Y/Y), other -0.4% (+2.5%Y/Y) and cafes, restaurants and takeaway food -0.6% (+2.2%Y/Y). While retail spending on a headline basis fell by 0.1% in the month, if the food category, which accounts for around 40% of total turnover, is omitted then overall discretionary spending fell by 0.3% month-on-month to an annual pace of 1.8%. 


On a state-by-state basis, retail spending was weak in July. Western Australia was the only state to record growth in turnover at 0.6% in the month, which saw the annual pace rise to 3.0% — its fastest since August 2015. Spending declined elsewhere; New South Wales -0.1% (+0.5%Y/Y), Victoria -0.1% (+3.3%Y/Y), Queensland -0.2% (+4.2%Y/Y), South Australia -0.5% (+1.7%Y/Y) and Tasmania -0.1% (+2.2%Y/Y). 


Growth in online retail sales lifted by 1.0% in July according to the ABS's estimates, though that came after a 2.2% contraction in the previous month. As a percentage of total retail turnover, online sales remained at 6.1% in July. 


Retail Sales — July | Insights

This report appears to indicate that the stimulus from the Reserve Bank of Australia's rate cuts in June and July and the federal government's tax cuts for low-and middle-income earners are yet to filter through to the real economy. Another consideration is that the improvement in conditions in the two major capital city housing markets of Sydney and Melbourne is only a recent development, though if proves to be sustained this would also be likely to support retail sales growth.