Independent Australian and global macro analysis

Thursday, April 4, 2019

In review: Australian Federal Budget 2019/20

Australia's Federal Budget for 2019/20 forecasts a return to surplus for the first time in 12 years at $A7.1bn or 0.4% of Gross Domestic Product (GDP). This is an upgrade of $2.9bn from December's Mid-Year Economic and Fiscal Outlook (MYEFO) that projected a 2019/20 surplus of $4.1bn (0.2% of GDP). For 2018/19, the budget deficit is $4.2bn, which is a $1.0bn improvement since MYEFO.


Overall, the profile of the budget has been revised modestly higher by $1.3bn over the 4 years out to 2021/22 compared with the forecasts from MYEFO. That reflects improved outcomes in the near term in 2018/19 and 2019/20, though the surpluses projected for the out years in 2020/21 and 2021/22 have been lowered. 

The details are now; 2018/19 a deficit of -$4.2bn ($1.0bn improvement), 2019/20 a surplus of $7.1bn ($2.9bn improvement), 2020/21 a surplus of $11.0bn ($1.5bn downgrade) and 2021/22 a surplus of $17.8bn ($1.2bn downgrade). The variations are shown in the table, below (click to expand).  


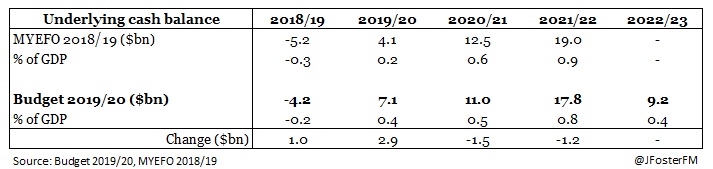
Government net debt is forecast to lift from 18.2% to 19.2% of GDP by the end of the 2018/19 financial year. The trajectory is then expected to improve in 2019/20 to 18.0% of GDP ahead of further moderation over the out years to an eventual 14.4% of GDP in 2022/23 (see table, below).    


Since MYEFO — Budget 2019/20 

Key to Budget 2019/20 is that it starts on an improved position relative to expectations from MYEFO. Since December, elevated prices for the nation's key commodity exports have held, delivering a sizeable boost to company tax receipts, particularly from the mining sector. This will continue to benefit the Government's fiscal position through 2019/20, due to the timing delay between the accrual of profit and when companies pay tax. Meanwhile, forecast expenditure has been lowered, mainly to reflect reduced GST distributions to the states in response to a weaker outlook for residential construction and household consumption, and a slower-than-anticipated transition of participants into the National Disability Insurance Scheme.

For 2018/19, the budget starts $4.0bn ahead of expectations from MYEFO and then by $5.7bn in 2019/20. The improvements then moderate to $1.4bn in 2020/21 and to $0.2bn in 2021/22. In total, this improves budget position by a total of $11.3bn over the four years out to 2021/22 
(see table, below). 


New Policy Measures — Budget 2019/20

Given this improved fiscal position, the Government has announced a series of new policy measures since MYEFO was tabled, of which the net impact presents a cost to the budget of $9.9bn over the coming 4 years. In detail, the new measures will have a net impact of $3.0bn in 2018/19, $2.7bn in 2019/20, $2.8bn in 2020/21 and $1.4bn in 2021/22. The projection for 2022/23 is for the net impact to accelerate to $3.4bn, in response to the Government's plan to raise the top threshold to the 19% tax bracket and increase the low income tax offset.


Budget 2019/20's new measures result in expenditure increasing by a total of $10.5bn over the coming 4 years. The headline new policy announcements include;


Revenue Measures (lowering government revenues) 

  • "Lower taxes for hard-working Australians" (increasing the low and middle income tax offset base from $200 to $255 for incomes up to $37,000, which rises incrementally for incomes between $37,000 to $48,000, with the maximum offset lifting from $530 to $1,080 to be available for incomes between $48,000 to $90,000, before gradually phasing out to zero at $126,000)2019/20 cost $0.8bn, 4yr cost $5.7bn
  • Increasing instant asset write-offs (from $25,000 to $30,000) for small businesses and expanding access to now include medium-sized businesses: 2019/20 cost $0.2bn, 4yr cost $0.4bn 
  • Increases to the Medicare levy low-income thresholds: 2019/20 cost $0.1bn, 4yr cost $0.3bn   

Expense Measures (increasing goverment expenditure) 

  • Infrastructure Investment Program — Urban Congestion Fund (next priorities): 2019/20 cost $0.4bn, 4yr cost $1.6bn 
  • Infrastructure Investment Program — Victorian Infrastructure Investments: 2019/20 cost $0.1bn, 4yr cost $1.2bn    
  • Medicare — Strengthening primary care: 2019/20 cost $0.1bn, 4yr cost $1.1bn
  • Aged care — More Choices for a Longer Life: 2019/20 cost $0.1bn, 4yr cost $0.6bn  
  • Universal Access to Early Childhood Education — 2019/20 cost $0.1bn, 4yr cost $0.4bn    

These measures are partly offset through savings made on the expense side, including from; 
  • Changing the Social Security Income Assesment Model  — 2019/20 saving $0.0bn, 4yr saving $2.2bn  
  • Better Distribution of Medical Practitioners — 2019/20 saving $0.0bn, 4yr saving $0.3bn   
In addition, there is a boost on the revenue side, mostly from;
  • Extension and expansion of the ATO Tax Avoidance Taskforce on Large Corporates, Multinationals and High Wealth Individuals: 2019/20 increase $0.1bn, 4yr increase $3.6bn    

Economic Forecasts — Budget 2019/20

The key economic forecasts the budget is based around include a downgrade to the outlook for the domestic economy in the near term. The real GDP growth forecast since MYEFO has been lowered to a below-potential rate of 2.25% in 2018/19 from the expectation for trend growth of 2.75% back in December. This lower starting point sees GDP growth improving in 2019/20, but only to trend (2.75%), whereas in MYEFO growth was anticipated to reach 3.0%. 


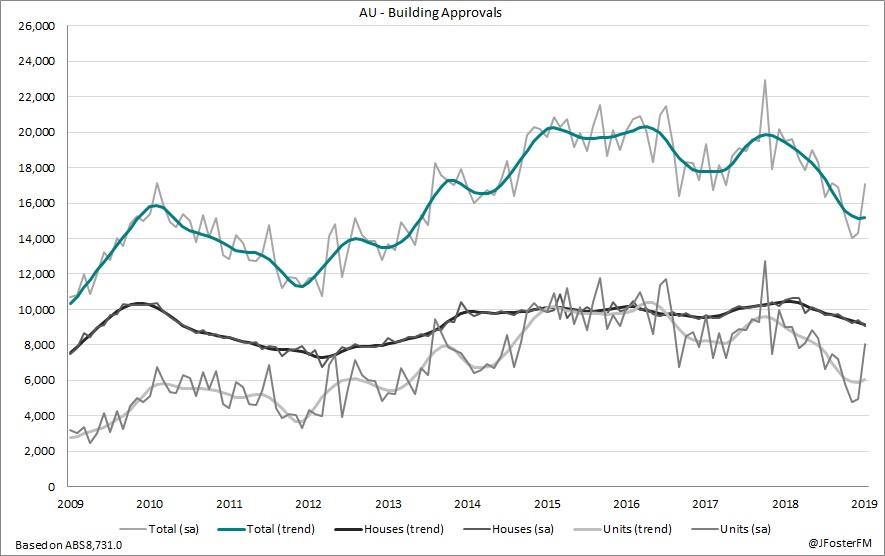
The softer outlook comes mostly in response to an acknowledgment of slower growth in household consumption through the second half of 2018 and a deterioration in the forecast for residential construction activity, impacted by property price declines, weakening approvals, tight credit conditions and dampened buyer sentiment. However, household consumption growth is forecast to improve in 2019/20, driven by the expectation for solid labour market conditions to continue, in turn leading to a pick-up in wages growth. Based on the current data flow, the risks appear to the downside.

The Government anticipates the growth outlook to be supported by non-mining business investment, with a 4% rise in 2019/20 after being in decline for nearly 7 consecutive years, public demand associated with its rollout of infrastructure projects, and export growth through the LNG sector, tourism, and education.  

The forecasts acknowledge a strengthening in the headwinds to the domestic economy from slowing momentum in the global economy. Global growth is now forecast to be 3.5% in 2019, 2020 and 2021, which is a slight downgrade compared with MYEFO. However, Treasury elected to retain forecast growth in the economies of the nation's major trading partners, including the US and China, at 4% in 2019, 2020 and 2021. A resolution to ongoing trade tensions is key to the global growth outlook.

MYEFO had set conservative forecasts for the prices of the nation's key commodities exports, with iron ore US$55/t, metallurgical coal US$120/t and thermal coal US$93/t (all quotes are Free on Board — FOB — prices). Since December, the spot iron ore price has run a little below US$90/t, while the metallurgical coal price averaged around US$200/t (FOB) across 2018, and the thermal coal price was also slightly stronger than anticipated. The upside surprise in commodities prices has delivered a sizeable lift to national income and is reflected through the Government's strengthened fiscal position.

This tailwind is expected to last for a little longer yet, with the terms of trade forecast to rise by 4% over 2018/19. However, that turns in 2019/20 where a decline of 5.25% is forecast ahead of a 4.75% slide in 2020/21. This reflects an expected fall in commodities prices by Q1 2020; iron ore to US$55/t (FOB) and metallurgical coal to US$150/t (FOB). National income, as measured by growth in nominal GDP, is forecast to rise by 5.0% in 2018/19 before moderating to 3.25% in 2019/20 and then lifting to 3.75% in 2020/21. 


Market Implications — Budget 2019/20

Growth in the domestic economy slowed sharply over the second half of 2018 to a well-below trend pace of 2.3% through the year (see chart, below). Activity was reasonably strong in the first half of 2018, expanding by an annualised pace of around 4%, which then fell to a 1% annualised pace for the second half, as household consumption slowed in response to persistent weakness in wages growth and a decline in net worth driven by falling property and equity prices, while activity in the residential construction sector turned over. In addition, Reserve Bank of Australia (RBA) analysis has identified that growth in taxes paid by households has been stronger than usual recently and beyond what is typically associated with bracket creep. These factors point to the need for stimulus in the domestic economy.


Financial markets expect this stimulus to come from an RBA interest rate cut of 0.25% by August, with increasing anticipation for a follow-up cut by year-end. Budget 2019/20 offers fiscal stimulus through tax relief to low-and-middle-income earners, which plans to return $750m to households in the financial year. Whether that would offer more than a short-term impact and be sufficient to alleviate some of the headwinds facing the household sector are the key questions for policymakers, financial markets, and the electorate.    

Link to Budget 2019/20 here

Tuesday, April 2, 2019

Australia posts a record trade surplus in February

Australia's monthly trade surplus of $4.8bn in February was the highest on record going back to 1971 and was also vastly stronger than forecast by markets. January's surplus of $4.35bn was the third highest on record.

International Trade — February | By the numbers
  • The trade surplus increased by $450m in February to $A4.801bn, much stronger than the $3.7bn market forecast. January's surplus was lowered in this update to $4.351bn from the $4.549bn figure reported initially.
  • Export earnings were little changed in February, rising by $77m, or by +0.2%, to $A39.833bn, with annual growth at 13.2% (prior rev: +4.8%m/m, +15.4%Y/Y) 
  • The import bill declined by $374m, or by -1.1%, in the month to $35.032bn, slowing annual growth to 4.4% (prior rev: +3.9%m/m, +6.1%Y/Y)


International Trade — February | The details 

Starting with the export side, total earnings lifted by a very modest $77m in the month. The underlying detail was mixed; non-rural goods +$127m and services +$136m largely offset by non-monetary gold -$142m and rural goods -$44m. The non-rural goods category includes the major resources commodities, in which iron-ore recorded a $958m increase mostly due to stronger prices, though coal exports fell by $760m on softer prices and volumes. Meanwhile, other mineral fuels (including LNG) lifted by $97m in the month. The rise in services exports is mostly due to a $117m increase in tourism-related services by overseas visitors.  


On the other side of the ledger, the total value of goods and services imported fell by $374m in the month, with the weakness centred on capital goods -$155m and intermediate goods -$443m. Consumption goods lifted by $12m and services increased by $235m. The fall in intermediate goods was largely due to fuels and lubricants -$344m. Capital goods were headlined by a $222m decline in ADP equipment. Services imports reflected a $209 rise in overseas tourism and a modest lift in 'other' (business) services. 

        
International Trade — February | Insights

February's record $4.8bn surplus follows January's surplus of $4.35bn, which was the third-highest monthly surplus on record. That gives an average surplus of around $4.6bn per month, a vast acceleration on the $2.9bn average monthly surplus over Q4. This looks to be predominantly driven by elevated commodity prices for the nation's key exports, notably iron-ore, following the supply shock in response to Brazil's tailings dam disaster. Last night's Federal Budget confirmed a greatly increased company tax in-take in 2018/19 driven by increased profitability in the mining sector, with more to flow through in 2019/20 providing the scope for tax relief announced for low-and-middle-income households.            

Australian retail spending lifts by 0.8% in February

Australian retail spending lifted by more than expected in February, though it follows a weak result from the previous month. With one month remaining in the quarter, growth in nominal retail spending is tracking at a modest rate but has improved from a weak finish to 2018.

Retail Sales — February | By the numbers
  • Retail turnover lifted by 0.8%, or by $223.0m, in February to $A27,267bn to be well clear of the market forecast for growth of 0.3% (prior: +0.1%)
  • Turnover growth lifted to 3.2% through the year, accelerating from the 2.7% pace in the 12-months to January in seasonally adjusted terms. On a trend basis, annual growth slowed to 2.9% from 3.1%. 

Retail Sales — February | The details 

The underlying detail from February was markedly upbeat when compared with January. In nominal terms, retail spending lifted by a sharp $223.0m in the month driven by broad-based gains across the sector; food +$86.0m (+0.8%), household goods +$49.7m (+1.1%), clothing and footwear +$34.2m (+1.6%), department stores +$53.0m (+3.5%). Spending in the 'other' category (+$0.7m, 0.0%) and cafes and restaurants (-$0.4m, 0.0%) was little changed. 


Excluding the impact of food sales, which accounts for around 40% of total retail spending, turnover growth posted its sharpest monthly increase since November 2017 after lifting by $137m or +0.9%. However, turnover growth ex-food at 2.0% through the year is well behind growth in total retail sales of 3.2%. 


Looking across the states, it was a rebound in spending in Queensland that dove the national result. In January, retail sales in that state slumped by 0.5% (or -$28.7m) but surged by 1.4% in February, which contributed $74.2m to the national increase of $223.0m. Outturns in New South Wales (+0.6%, +$56.4m) and Victoria (+0.8%, +$54.7m) were solid in February. South Australia (+0.7%, +$12.2m) and Western Australia (+0.6%, +$17.3m) also contributed to retail spending in the month. Tasmania recorded a sharp decline in the month of 0.7% (-$3.7m). 


The trajectory of growth in retail spending has slowed in both New South Wales and Victoria. This fits with Q4's National Accounts that highlighted a sharp slowing in activity over the second half of 2018, due to the household sector reining in consumption in response to slow income growth and declining property prices and a weakening in residential construction.


For the other states, the data are more volatile. Still, growth looks to be on an uptrend in Queensland and Western Australia, though spending appears to be slowing in South Australia and Tasmania.


Lastly, according to the ABS' estimates, online retail spending declined for the second consecutive month, with a $9.1m fall in February to $1.35bn, which is consistent with what has been seen in previous years. As a percentage of total retail turnover, the online space remained at 5.6% in February.


Retail Sales — February | Insights

This was a much stronger-than-expected result relative to market expectations and offers some optimism around the household sector, particularly given the board-based nature of the strength in the underlying detail in discretionary spending and on a state-by-state basis. The measures announced in last night's Federal Budget around tax relief for low-and-middle-income earners are also supportive of the household consumption outlook. Averaging January (+0.1%) and February's (+0.8%) outturns shows growth in retail turnover of around 0.5%, which while still fairly modest indicates that spending has at least not deteriorated in early 2019. 

RBA on hold: signal data dependent approach

The Reserve Bank of Australia (RBA) Board held the cash rate steady as expected at 1.50% today, though the Governor's statement (see here) provided a few highlights. The key point of interest was a change in the wording to the final sentence of the statement, which markets look to as a gauge of the outlook of the Board.


In March, the guidance was that "... the Board judged that holding the stance of monetary policy unchanged at this meeting would be consistent with sustainable growth in the economy and achieving the inflation target over time", whereas today the Governor noted "The Board will continue to monitor developments and set monetary policy to support sustainable growth in the economy and achieve the inflation target over time." 

There are two reasons why this is notable to markets; firstly, the previous guidance had been used by the Governor in every monthly decision statement ever since April 2017, and secondly, it indicated the Board is prepared to take a flexible approach to policy settings if warranted by the data. Market pricing has shifted aggressively over recent weeks, with a 25 basis point (0.25%) cut expected by August and a further 15 basis points of easing priced in by year-end. 

Today's statement continued the recent theme in RBA communication in highlighting what it has referred to as 'tension' in the data -- essentially mixed signals between economic activity and strength in labour market data -- by noting "the GDP data paint a softer picture of the economy than do the labour market data".

After Q4's GDP data confirmed a sharp slowing in activity over the second half of 2018, the Board acknowledges that household consumption has been reined in due to a "protracted period of weakness in real household disposable income and the adjustment in housing markets". In mitigation, assessment of the labour market is described as "strong" going on to highlight that "there has been a significant increase in employment and the unemployment rate is at 4.9 per cent". How this nexus evolves is critical given the Board's data dependent approach. For now, the statement highlighted high job vacancies and skills shortages in certain areas as positives to the employment outlook.

Also worth noting is that the Board's assessment of the global economic conditions has softened by acknowledging that "growth has slowed" and continuing to point out that downside risks have increased, specifically mentioning declining global trade and softening intentions for investment. As recently as March, the Governor highlighted that a slowing global economy presented risks to the domestic outlook, which is underpinned by public infrastructure investment, private sector investment and labour market conditions.   

Monday, April 1, 2019

Australian building approvals post volatile rise in February

Australian dwelling approvals surged in February by 19% on a seasonally adjusted basis — its sharpest monthly rise in 5½ years — against market expectations for a modest decline. The result reflected a pronounced lift in unit approvals in Sydney and Melbourne, with the usual seasonality impacts during the summer months also likely to be at play. 

Building Approvals — February | By the numbers
  • Total dwelling approvals (including the private and public sectors) increased by 19.1% in February to 17,074 (seasonally adjusted) compared to a 1.8% decline forecast by markets. January's initially reported increase of 2.5% was lowered on revision to 2.3%. 
  • Through the year, total dwelling approvals have fallen by 12.5% (prior rev: -28.9%)
  • Unit approvals skyrocketed by 62.4% (prior rev: +3.3%) in February to 8,035 to cut the annual fall from 50.5% to 10.6%. 
  • Approvals for houses fell by 3.7% (prior rev: +3.3%) to 9,038 in the month for an annual decline of 14.2% (prior rev: -7.7%)
  • The smoothed trend series showed; total approvals lifted by 0.4% to 15,203 in February, with an annual decline of 21.7%. Unit approvals posted a 2.5% monthly rise to 6,038 (-32.7%Y/Y) with houses falling by 0.9%m/m to 9,166 (-12.3%Y/Y). 

Building Approvals — February | The details 

Clearly, this was a very volatile report impacted by approvals in the unit category. Unit approvals are usually volatile as a rule, due to the lumpy nature of high-density projects in particular, with that effect amplified in these data. The underlying detail suggested that high-rise approvals accelerated in February across both Sydney and Melbourne. Stepping away from the monthly figures, unit approvals on a trend basis remain sharply lower on a year earlier having fallen by almost 33%. At best, though, there are tentative signs that unit approvals are beginning to stabilise at around pre-boom (pre-2015) levels. 


For house approvals, February's data was broadly consistent with the ongoing slowing from the past several months. As Q4's National Accounts showed, residential construction activity deteriorated sharply over the second half of 2018 with the approvals data continuing to suggest this will persist in 2019. Notably, the weakness in house approvals has been broad-based across the nation over the past year, as shown in the table (below). 

The full state-level detail is also shown in this table, again noting the heightened volatility in the monthly changes.


In February, the value of alteration work to residential properties lifted by 4.4% to $733.2m around a gradual uptrend over the past few months. The value of non-residential work approved in the month increased by 2.1% to $3.7bn, which also appears to be on a gently rising trend. 


Building Approvals — February | Insights 

Given the volatility, the seasonally adjusted results can be largely discounted. The trend series lifted modestly in February (+0.4%) but only after a larger decline in January (-0.8%), while approvals remain sharply down through the year (-21.7%). Approvals for houses continue to soften, though there are early signs that unit approvals may be beginning to stabilise. Residential construction activity can be expected to remain a headwind to the domestic economy through 2019. 

Friday, March 29, 2019

Macro (Re)view (29/3) | Yield inversion signals weaker outlook

With relatively few headline events and data releases from a macro perspective on the calendar this week, the key focus in markets was around recent moves in yield curves from the US and across the globe. Last Friday, much weaker-than-expected surveys on business activity, most notably in manufacturing, in the US and Europe hit sentiment as markets anticipated the recent slowdown in economic growth to extended beyond the first quarter of the year. Concerns over the growth outlook were reflected in long-term bond yields declining below those at the front end of the curve as investors turned away from riskier asset classes.

The most widely followed curve by markets 
 the spread between the US 3-month and 10-year yields  has inverted, as shown in our chart of the week (below). Historically, inversion of the 3-month 10-year spread has been a reliable predictor of an upcoming recession in the US, with a lead time of roughly 12 to 18 months. Only time will tell if things turn out differently on this occasion — and there are sound arguments as to why signals from the yield curve may not be as predictive as they have been in the past — though markets are clearly wary of signs of late cycle weakness given the US is fast approaching its longest period of economic expansion on record. Meanwhile, the third and final estimate of US GDP growth in Q4 was this week trimmed to an annualised pace of 2.2%, down from 2.6% in Q3. Forward-looking PMI data indicates that GDP growth in Q1 is likely to come in around 2% on an annualised basis. 


Chart of the week

Brexit's state of bedlam showed few signs of abating this week. Firstly, MP's voted in favour of seizing control of the Brexit process for a day in an attempt to try and find a way out of the impasse. However, a series of non-binding indicative votes held on Wednesday only resulted in MP's voting against all 8 options put forward as alternatives to PM Theresa May's Brexit deal. PM May announced during the week that she would resign if her existing deal was passed by the parliament. On Friday (UK time), a parliamentary vote took place on the withdrawal agreement aspect (relating to the terms of the UK's exit from the EU and the Irish backstop) of the PM's Brexit proposal, which was defeated by a margin of 286 to 344 placing further uncertainty over the path forward. 

In Europe, European Central Bank (ECB) President Mario Draghi maintained that the policy stance would remain supportive, including "if necessary" possible measures aimed at preserving "the favourable implications of negative rates for the economy, while mitigating the side effects, if any". This is in relation to the ECB's deposit facility rate which is presently set at -0.4%. While this is aimed at incentivising lending to the real economy, 'side effects' refer to the potential impact on the profitability of the euro area's banks, as they effectively pay to maintain excess liquidity with the ECB on an overnight basis. Media reports had indicated that there had been discussions within the ECB around introducing a tiered deposit rate that would be aimed at reducing some of that cost faced by the banks amid a broader slowing in economic activity in the region. Such a move could be interpreted as indicating that negative rates were likely to remain part of the policy mix for a more extended period of time.  

Closer to home, the Reserve Bank of New Zealand was the latest central bank to move to a dovish stance by noting in its latest policy decision statement that "the more likely direction of our next (rates) move is down" with risks to the outlook having "shifted to the downside" in response to a weaker forecast for global growth and slowing domestic demand.    


— — 

The Australian data flow was decidedly second tier this week, as local markets focused on developments offshore. Government bond yields continued to slide with the 10 year reaching new lows below 1.8%, while the spread to the 2 year flattened out to its lowest since late 2010. Meanwhile, market expectations for Reserve Bank of Australia (RBA) easing firmed further this week; pricing on cash rate futures now indicates a 25 basis point (0.25%) cut is anticipated in August, with an additional 15 basis points of easing priced in by year-end. The consensus view of both markets and economists continues to shift towards the cash rate ending 2019 at 1.0% from its current level of 1.5%. The RBA Board meets next Tuesday and while no change to rates is expected, there will be close scrutiny of the Governor's statement for signs of a downgrade in their assessment of economic conditions and the outlook. 

Staying with the RBA theme, Assistant Governor (Economic) Luci Ellis delivered a speech titled: What's Up (and Down) With Households? that provided a highly insightful perspective on the Bank's thinking around the household sector. It is very clear that the Bank has gained confidence from the strengthening in labour market conditions over the past year or so and highlighted the broad-based nature of employment growth. It has noted a gradual rise in wages growth — particularly in the private sector — citing tightening conditions, removal of wage freezes and increases to awards, though the unemployment rate was still some way off being consistent with a more material pick-up. 


The impact of slow income growth and expectations for that to persist has weighed on household consumption. The overall growth in households' income has been impacted by softness in labour income (wages and bonuses) as well as from non-labour sources (social assistance and income derived from rent, other investments and businesses). However, the key takeaway was that growth in taxes paid by households has over recent years been increasing by an above-average margin relative to the rate of growth in their gross income, with that situation becoming more pronounced over the past year. That analysis sets the scene ahead of next week's Federal Budget (April 2), in which fiscal policy through tax relief and infrastructure investment is likely to feature prominently. 


In terms of data, the ABS' Job Vacancies series showed a 1.4% rise over the quarter to February and by 9.9% through the year. While the pace of growth is slowing, it remains relatively solid and the total number of vacancies is at a record high, all of which appears to indicate that a near-term deterioration in labour market conditions is unlikely.


Private sector credit growth lifted by 0.3% in February, a slightly stronger-than-anticipated outcome, though the annual pace eased to 4.2% from 4.3%. Total credit growth for housing slowed to a 4.2% annual rate — its lowest on record dating back to 1977 — reflecting the impact of tight lending assessment criteria following the banking royal commission. Growth to the owner-occupier segment was 5.9%Y/Y and just 0.9%Y/Y to investors marking a new record low.    

Friday, March 22, 2019

Macro (Re)view (22/3) | Fed turns dovish; Australian data tension

Global markets were heavily focused on this week's policy meeting from the US Federal Reserve. The Committee left its key interest rate unchanged but surprised the markets by taking on a more dovish stance than had been expected, with slowing global growth and lingering uncertainties from trade and Brexit noted as risks to the outlook for the US economy. Those risks were downplayed by Fed Chair Jerome Powell at the associated press conference by describing the domestic economy as being "in a good place", though growth was expected to moderate to a "solid pace" this year from its "very strong pace of 2018".

The Committee members' median projection for GDP growth in 2019 was lowered to 2.1% from 2.3% and to 1.9% from 2.0% for 2020, while the outlook for the unemployment rate was also downgraded to 3.7% from 3.5% this year and to 3.8% from 3.6% for next year. Chair Powell commented that the updated projections "point to a modest slowdown, with overall conditions remaining favourable". Given that the fed funds rate is assessed to be around its neutral estimate, that in the Committee's view justified it being "patient in assessing the need for any change in the stance of policy". 


As a result, the median projection now points to rates being left on hold through the remainder of the year, removing its implied expectation for 2 rate increases in 2019 that were projected at its December meeting. The median projection for 1 rate increase in 2020 was retained. In basic terms, that points to the fed funds rate now reaching a midpoint of 2.6% in 2020, whereas in December the projection was at 3.1%. Completing its dovish turn, the Committee announced that it would reduce its balance sheet run-off from $30bn to $15bn per month starting in May, before reaching an end in September at a terminal value likely to "be a bit above $3.5 trillion" according to Chair Powell. Slowing the pace of run-off and maintaining the balance sheet at that level is intended to ensure ample liquidity remains in the system to prevent financial conditions from tightening through higher market interest rates.


In the UK, it was another dramatic week in Brexit developments. An expected third 'Meaningful vote' on PM Theresa May's Brexit deal was knocked back by the Speaker of the Commons under an obscure and historical convention of parliamentary procedure. PM May, then, on Wednesday wrote to European Council President Donald Tusk formally requesting an extension to Article 50 of the Brexit deadline set at March 29 until June 30, 2019. On Friday morning local time, President Tusk announced that the EU 27 leaders had agreed to an extension, though the details are somewhat complicated. If over the next week the UK Parliament is able to approve the existing Brexit proposal, the withdrawal will take place on May 22. However, if that approval is not forthcoming, the UK has until April 12 to outline to the EU how it plans to proceed. All scenarios remain open up until that new cliff-edge date of April 12 including; an exit with a deal, a no-deal exit, a long extension to the withdrawal date or effectively a cancelling of Brexit by revoking Article 50.


Given the persisting uncertainty, the latest policy meeting from Bank of England (BoE) held during the week saw rates on hold as expected, with commentary heavily focused around Brexit, highlighting that "the economic outlook will continue to depend significantly on the nature and timing of EU withdrawal". Regardless of the outcome, the BoE pointed to a weakening in confidence and in short-term activity, driven by reduced business investment, as the impacts on the economy from Brexit. However, it noted that a strong labour market had helped to moderate those headwinds. The BoE retained the line that its policy response to Brexit "will not be automatic and could be in either direction". 


— — —

Turning to the domestic focus over the week, the Reserve Bank of Australia's (RBA) March meeting minutes provided several points of interest. The key development was that the Board had identified 'tension' in the domestic data flow, specifically that the labour market had been improving despite slowing momentum in economic growth. The March meeting took place the day before Q4's National Accounts were released, where the Board had anticipated output growth to be "a little lower" than the 2.75% (year-on-year) that it had forecast in February's Statement on Monetary Policy". Q4's growth outcome of 2.3% was potentially below that guidance, though its expectation for "a markedly slower pace of growth in the second half of 2018 than in the first half" was confirmed.

In spite of slowing growth, due mainly to weakness in household consumption and residential construction, the minutes noted that forward-looking indicators had "pointed to further tightening in the labour market in the near term". How this situation plays out is key and as the Board later indicated, it will await further data before reaching a firm assessment given the uncertainties involved. For the moment, the Bank's guidance is 'neutral' by continuing to note that scenarios under which the cash rate could increase or decrease "were more evenly balanced than they had been over the preceding year". The Board, however, gave a clear indication that it will take a data dependent approach by noting that "members agreed that developments in the labour market were particularly important".

To that end, Thursday's Labour Force Survey for February was keenly anticipated by the markets, though it ultimately provided few clear signals — in either direction (see here for our full review). Employment lifted by a softer-than-expected 4,600 in the month on a seasonally-adjusted basis (vs median forecast for +15,000), but the national unemployment fell to its lowest level since June 2011 at 4.9%, as workforce participation declined. 

Given those conflicting signals, the trend series data perhaps offers a better guide. On that basis, both the unemployment (5.0%) and participation (65.6%) rates continued to remain unchanged from recent months, though monthly employment growth has softened recently, as shown in our chart of the week (below) to around 22,000 in the month. That level is still solid and above what is generally required to prevent the nation's unemployment rate from rising, but a continuation of that trend would likely change that situation and will only increase the importance of forward-looking indicators of labour market activity (such as vacancies and hiring intentions) for markets in the near-term.   


Chart of the week

The housing market is rarely far from focus and this week, there was a speech from the RBA's Michele Bullock (see here) which highlighted that the combination of household indebtedness and declining property prices over the past year were not regarded as significant enough to be raising financial stability concerns. Lastly, the ABS reported capital city property prices declined by 2.4% in Q4 and by -5.1% through the year (see our analysis here).  

Wednesday, March 20, 2019

Australia's unemployment rate sub-5% on lower participation

Australia's unemployment rate fell below 5% for the first time since mid-2011 in February, as participation in the labour force declined. Employment increased by a net 4,600 in the month to come in short of the consensus outcome, which last occurred in September 2018. Overall, the report provided no clear signals of deterioration in labour market conditions  now the key factor in Reserve Bank of Australia policy considerations going forward. 


Labour Force Survey — February | By the numbers
  • Employment increased by a net 4,600 in seasonally-adjusted terms, which was well below the meadian forecast for +15,000. January's intially reported 39,100 increase was revised down to +38,300.
  • The nation's unemployment rate declined to 4.9% from 5.0% (exp: 5.0%, prior: 5.0%). 
  • The underutilisation rate fell by 0.2ppt to 13.1%, while the underemployment rate held at 8.1%. 
  • The participation rate declined by 0.1ppt to 65.6% (exp: 65.7%)
  • Hours worked lifted by 0.2% in the month to 1.77bn and by 2.2% through the year (prior: +0.4%m/m, +3.3%Y/Y) 


Labour Force Survey — February | The details 

To the details, labour force participation declined from 65.7% to 65.6% in February on a seasonally-adjusted basis. That equated to 7,100 fewer people either in work or actively looking for work. With employment increasing by a net 4,600, that meant the total number of unemployed fell by 11,700, which explains the decline in the headline unemployment rate from 5.0% to 4.9% (at 2 decimal places from 5.03% to 4.95%). On a trend basis, the participation rate held at 65.7% for the 8th consecutive month and the unemployment rate at 5.0% has been unchanged for the past 3 months. 

The increase in employment of 4,600 was the net result of full-time work falling by 7,300 and part-time rising by 11,900. Through the year, employment growth lifted to 2.3% from 2.2%, though that was driven by a base effect (employment fell by 3,300 in February 2018). Employment growth slowed across the second half of 2018 from a very strong level, possibly in response to notably weaker activity in the economy, but still remains solid and comfortably outpaces growth in the labour force at around 1.7 to 1.8%.


Total hours worked lifted by 0.2% in the month and by 2.2% for the year, with growth looking to be on a mildly upward trend. When adjusted for the increase in employment, average hours worked per employee in the month was little changed in February (+0.1%) and over the year (-0.1%) at 138.7 hours. 


The underemployment rate remained at 8.1% but is still historically elevated indicating that there are many workers wanting more hours than they are currently receiving. The broader underutilisation measure (including the unemployed and underemployed) drifted down to 13.0% — its lowest since mid-2013. 


Turning to the state detail, there were some sizeable moves in unemployment rates but different from what has been reported over recent months. Unemployment in the 'major 2' increased; New South Wales +0.4ppt to 4.3% and Victoria +0.2ppt to 4.8%. That would be significant if that continued because those two states have driven national employment growth over the past year or so (see below).


Unemployment, however, declined in the other states; Queensland -0.7ppt to 5.4%, South Australia -0.6ppt to 5.7%, Western Australia -1ppt to 5.9% and Tasmania -0.5ppt to 6.5%. Though pleasing, single-month moves at the state level tend to be volatile so caution would be advisable.


Labour Force Survey — February | Insights

This was a highly anticipated release given the RBA's minutes from its March meeting highlighted that "(Board) members agreed that developments in the labour market were particularly important" in terms of its economic outlook. For the time being, there is little to suggest a deterioration in conditions has occurred, more like a softening, though the counter-argument is that labour market data are a measure that lags activity in the economy. Forward-looking indicators present risks to the employment outlook. The key consideration for markets is whether the RBA will wait for the data to confirm a potential weakening in the labour market before considering easing, or possibly look to take a more proactive stance. Given Tuesday's RBA minutes gave attention to 'tension' in the data — referring to resilient labour market conditions despite slowing economic growth that has also been experienced globally — it may lean towards the former.