- Sydney -3.9% (-10.3% in year-on-year terms)
- Melbourne -3.8% (-9.4%)
- Brisbane -1.5% (-1.3%)
- Adelaide -0.2% (+0.8%)
- Perth -1.1% (-2.7%)
- Hobart -0.4% (+4.6%)
- Darwin -1.8% (-4.2%)
- Canberra -0.9% (0.0%)
- Weighted-average of capitals -3.0% (-7.4%)
The table, below, shows the price movements in each capital city for houses and units.
The next chart shows the price index for each capital over the history of the series.
On an average weighted basis, Australian property prices have been declining for 5 consecutive quarters since the most recent peak in Q4 2017. That has largely been driven by Sydney and Melbourne, though that weakness now extends to the other capital cities where prices are also declining.
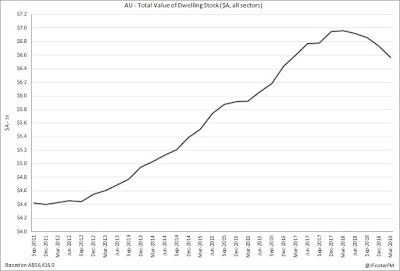
Accordingly, the ABS estimates that the total value of residential housing fell by 2.6% in the March quarter to $A6.6 trillion and has declined by 5.6% across the year.
The ABS' indexes are released quarterly and are compiled using data provided by CoreLogic. In that sense, this series is seen very much as a lagging indicator given that more timely updates are provided monthly by CoreLogic. May's update showed that the national median price fell by 0.4% in the month and by 7.3% across the year (see here). Furthermore, there have been a number of key recent developments that are not reflected in the ABS' indexes, which include; the Reserve Bank of Australia's June rate cut, banking regulator APRA's proposal to ease loan serviceability assessment criteria and the federal election outcome removing uncertainty around changes to tax policy. Recent auction clearance rates have also improved in Sydney and Melbourne, though off lower volumes.


