Consumer Price Index — Q3 | By the numbers
- Headline inflation was 0.4% in Q3, while the annual pace slowed to 1.9% — market expectations were for 0.5%q/q and 1.9%Y/Y (prior in Q2: 0.4%q/q and 2.1%Y/Y)
- Core inflation was softer than expected in Q3 at 0.32% (exp 0.4%), which saw the annual pace essentially unchanged at 1.75% (exp 1.9%). In Q2, core inflation was revised to 0.42%q/q and 1.77%Y/Y from the initial estimates of 0.46%q/q and 1.87%Y/Y.
click to expand
Consumer Price Index — Q3 | The details
Looking across the details of the groups that make up the CPI basket, the standout factor was from 'furnishings, household equipment, and services', which overall subtracted 0.12ppt from inflation in Q3. Childcare comes under this category as a component of household services. By itself, childcare subtracted 0.19ppt from inflation in the quarter as a result of the changes to federal government subsidies, which help to offset the cost of those services. Other subtractions were minor; health -0.02ppt — from lower pharmaceutical and medical services costs — and communications -0.04ppt — due to cheaper equipment and services costs.
Food and non-alcoholic beverages saw its strongest contribution to quarterly inflation this year at 0.09ppt, with fruit and vegetables adding 0.05ppt to that figure. The ABS reported that these increases were a reflection on supply issues stemming from adverse-weather conditions early in 2018. Meanwhile, the contributions from alcohol and tobacco were 0.05ppt and 0.06ppt, respectively.
Sources of inflation from discretionary areas of retail remain subdued, with clothing and footwear adding just 0.01ppt in Q3. Meanwhile, the transport group added 0.09 to inflation, with fuel accounting for 0.06ppt of that increase.
The strongest contribution to inflation came from 'recreation and culture' at 0.23ppt, which reflected a strong 0.15ppt rise in the cost of international holiday travel, while domestic holiday travel added 0.08ppt.
The chart, below, provides the price changes across the categories in percentage terms for Q3 and over the past year.
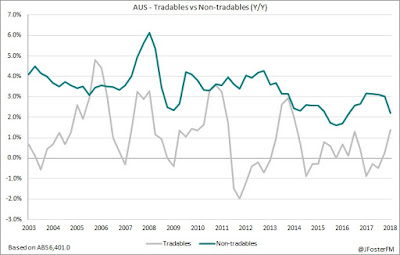
Inflation from non-tradables — largely reflecting domestic factors — despite easing from an annual pace of around 3% to 2.2% following the changes to childcare subsidies, continues to drive the inflationary pulse in Australia. Inflation from tradables — goods and services where prices are influenced by global market forces — has been lifting but remains subdued at around 1.4% in annual terms.
Consumer Price Index — Q3 | Insights
A soft inflationary outcome was expected in Q3, and this was signaled by Reserve Bank of Australia in their previous Statement on Monetary Policy, which highlighted the changes to the childcare subsidies as well as some other once-off impacts in the quarter around education costs and car registrations. The softening in core inflation, though, reverses momentum that appeared to be building towards the lower 2% target.
Highlighting the soft inflationary environment, market goods and services ex-volatile items — reflecting market-based inflationary pressures and removing once-off impacts from government policy changes — remains stuck at around 1.1%Y/Y. Administered prices — areas impacted by government policy such as alcohol, tobacco, utilities, childcare, private health insurance etc — continue to be the predominant sources of inflation in Australia.


