The lockdowns in place across large parts of Australia over the winter following outbreaks of the Delta variant of Covid-19 led to a significant deterioration in economic conditions. Real GDP contracted by 1.9% in Q3 and while this was an upside result relative to the market consensus for a 2.7% fall, it was still the nation's third largest quarterly contraction on record. Growth through the year slowed to 3.9% from 9.5%.
Ahead of the Delta lockdowns, the Australian economy had established very strong momentum. Activity had advanced by 2.5% through the first half of the year and real GDP was 1.8% higher than its pre-pandemic level at the end of 2019. With the lockdowns sharply disrupting this momentum, the associated contraction in Q3 led to a backsliding of the expansion phase, with real GDP falling to 0.2% below its pre-pandemic level.
Aside from the deterioration in the domestic economy, conditions offshore were also a headwind during Q3. Recoveries across the globe slowed due to the rise of the Delta variant, while supply constraints and the persistence of related inflation pressures intensified. GDP growth across OECD economies is estimated to have slowed to 0.9% in Q3 from 1.7% in Q2. Outside of the US and China, GDP remained below pre-pandemic levels in most economies. The US economy slowed sharply in Q3 (0.5%) as the Delta variant weighed on household services consumption and goods spending contracted due to a large fall in vehicle purchases amid supply shortages. Summer reopenings following earlier vaccination rollouts continued to drive activity in the euro area (2.2%) and in the UK (1.3%) in Q3, though supply chain pressures had been a constraint on production. Activity restrictions and measures by the authorities to curb leverage had driven a slowdown in China in the quarter (0.2%). GDP in Japan contracted in Q3 (-0.8%) on tighter restrictions as virus cases surged around the time of the Tokyo Olympics, while auto production was held back by input shortages.
In Australia, lockdowns returned in Q3 as Delta outbreaks led to an acceleration in caseloads from very low levels. Lockdowns were in place across New South Wales, Victoria and the Australian Capital Territory for much of the quarter. There were short lockdowns in some of the other states including Queensland and South Australia. In this lockdown cycle, restrictions on some sectors, including retail and construction, were more stringent than seen previously. Mobility indicators in the nation's two largest capital cities in Sydney and Melbourne fell to the levels seen in earlier lockdowns but remained elevated, on average, across the other capital cities.

The 1.9% contraction in quarterly GDP was driven mainly by a sharp decline in household consumption (-2.5ppts) as the lockdowns restricted spending opportunities, particularly in services and discretionary categories. However, alongside the fall in spending, governments had ramped up payments to support households with many people on reduced hours or unable to go to work altogether. As a result, the household saving ratio has surged higher again and is just off the highs seen in 2020 at 19.8%. Pressures in global supply chains drove a substantial fall in business inventories and this weighed heavily on activity in Q3 (-1.3ppts). Amid the lockdowns, firms pushed back equipment spending, temporarily pausing the upswing in the business investment cycle (-0.1ppt). Capacity constraints and restrictions have stalled residential construction activity. Attenuating the weakness in private demand, public demand lifted (0.9ppt) as the vaccine rollout accelerated. Net exports swung from a large contraction in Q2 to add 1ppt to activity in Q3. Resources exports rebounded but import spending fell in line with weak domestic demand conditions and global product shortages.

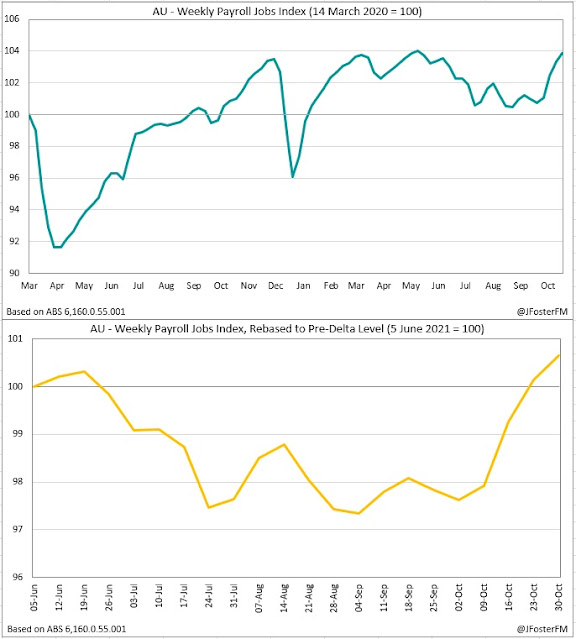
With vaccination rates surpassing key thresholds, lockdowns across the nation were eased early in Q4. The reopening phase is now well underway and the national vaccination rate is on track to rise well into the 90% range by the end of the year. High-frequency data sources indicate momentum in the economy is gathering pace; mobility is elevated, household spending is rebounding supported by accumulated savings and the labour market is recovering with employment levels on the rise.
Overall, the Delta setback is a recovery delayed, not derailed, and GDP growth in Q4 should easily regain the lost output seen in Q3. The 1.9% fall in GDP was not as large as feared and is relatively modest considering hours worked across the economy were down 5.4%q/q. This points to the degree of adaptation that has occured since the outset of the pandemic, with spending online surging to record levels and businesses more accustomed to operating around restrictions.
— — —
GDP — Q3 | Expenditure: GDP (E) -2.0%q/q, 3.9%Y/Y
Household consumption (-4.8%q/q, 1.8%Y/Y) — The return of extended lockdowns led to a 4.8% contraction in household consumption, its second largest quarterly fall on record surpassed only by the 12.1% plunge seen during the 2020 national lockdown. This leaves household consumption down 5.2% on its pre-pandemic level.
Household consumption fell by 8.4% across New South Wales, Victoria and the Australian Capital Territory where lockdowns were in place for much of the quarter. Across the other states and territories, household consumption was up by 0.7%q/q, just about matching the rise seen in the previous quarter.

Consistent with earlier lockdowns, the categories of household consumption that showed the largest falls were in services (-5.8%q/q) and discretionary consumption (-11.3%q/q). For comparison, much deeper declines were seen in last year's national lockdown with services -17.4%q/q and discretionary consumption -23.7%q/q. In Q3, with domestic travel curtailed by state border closures and with restrictions in place in the hospitality sector and at entertainment venues, large falls were seen in transport services (-40.9%q/q), hotels, cafes and restaurants (-21.3%q/q) and in recreation & culture (-11.8%q/q). As a result, services consumption has fallen back to be 9.5% down on its pre-pandemic level while discretionary spending is 14.7% lower across the period. Goods consumption contracted by 3.3%q/q, a much smaller decline than services. In part, this reflects the boost goods consumption received when services were unavailable in lockdowns, which helped drive online sales to new record highs. Weighing on goods consumption in Q3 were new vehicles purchases, reflecting unavailability due to global shortages, while fuel (-13.1%) and clothing and footwear (-22.0%q/q) fell in response to activity restrictions. The decline in fuel weighed on essential consumption, down 0.9%q/q. Amid the lockdowns, demand for both food (5.2%q/q) and alcoholic beverages (7.4%) surged. Goods and essential consumption remain above pre-pandemic levels.
While the lockdown disruptions caused hours worked to contract by 5.4% in Q3, gross household disposable income lifted by 4.6%q/q, posting its sharpest rise since Q4 2008. This was driven by governments ramping up support payments to households through the lockdowns, with social assistance benefits surging by 25.4%q/q. Adjusting for inflation, real growth in household disposable income accelerated by 4.3% in Q3 to be up 1.1% through the year. This configuration of outcomes with real income rising at a time of falling consumption saw the household saving ratio surge up from 11.8% to 19.8% and is just below the highs seen in 2020. This significant volume of accumulated savings will support the recovery in Q4 and help to sustain a strong pace of GDP growth through 2022.
Dwelling investment (0.1%q/q, 11.4%Y/Y) — The upswing in the residential construction cycle has stalled on capacity constraints and the effects of restrictions placed on the sector during the Delta lockdowns. Dwelling investment slowed further in Q3 to 0.1% from 0.6% in Q2 as the earlier surge driven by stimulus measures from the HomeBuilder scheme, first home buyer incentives and low interest rates has plateaued, though it is up 11.4% through the year.
New home building contracted for the first time in a year with a 1.6%q/q fall as activity in New South Wales plunged by 10.1%q/q amid the Sydney lockdown. However, this was offset by a reacceleration in alteration work (2.5%q/q) after a flat Q2. Residential construction is up 6.9% on pre-pandemic levels around an uneven mix. Alterations have surged by 22.2% with the support of the HomeBuilder scheme while the lockdowns have encouraged many Australians to make modifications to their home, but new home building is lower over the period (-1.9%).
Despite restrictions on property inspections during the Sydney and Melbourne lockdowns, these markets remained robust and housing prices nationally increased by 5% over the quarter. This supported a 3.1% lift in ownership transfer costs — relating to fees associated with real estate transactions — to be 41.1% higher over the year.
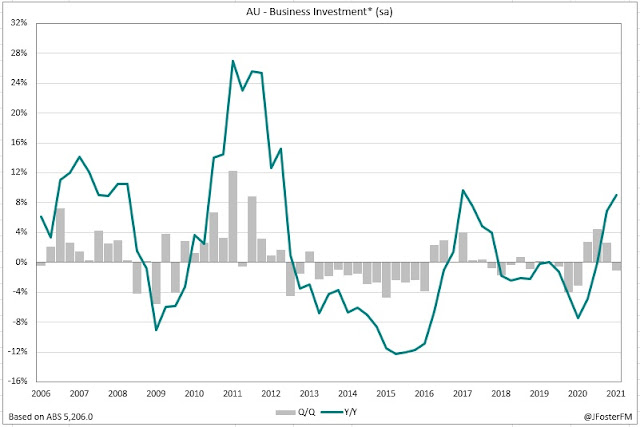
Business investment (-1.1%q/q, 9.0%Y/Y) — With extended lockdowns returning in the quarter, measures of business confidence and trading conditions deteriorated substantially, though they held up at far better levels than in 2020. These dynamics drove a 1.1% contraction in business investment in the quarter, temporarily pausing the upswing in the cycle.
Equipment spending has been the impulse behind the upswing on the back of a rebounding economy, tax incentives and accommodative financing conditions. However, in Q3 it led the overall decline with a 3.1%q/q fall. The lockdowns clearly caused spending decisions to be delayed, while product shortages may have also been a contributing factor. Despite this, equipment spending was still 4.9% above pre-pandemic levels. After rising strongly in Q2, non-dwelling construction stalled in the quarter (-0.1%q/q), weighed by the Covid restrictions placed on the construction sector. Following the disruptions of Q3, the recent ABS Capital Expenditure Survey reported that firms have substantially lifted spending plans through the remainder of the financial year.
Public demand (3.3%q/q, 7.2%Y/Y) — The rollout of Covid-19 vaccines by federal and state and territory governments drove to the fastest quarterly acceleration in public consumption spending since the mid-1990s with a 3.6% rise in Q3. Together with a 2% rise in underlying investment, public demand increased by 3.3% in the quarter to be up by a very strong 7.2% through the year.
Inventories (-1.3ppt in Q3, -0.7ppt yr) — Global supply chain constraints and the disruptions associated with the domestic lockdowns weighed on inventories in Q3. Cuts to production amid input shortages led to reduced motor vehicle dealership inventories, reflected in a large decline in wholesale inventories. Manufacturing inventories fell as product shortages became more widespread and delivery times lengthened out. Inventories were declining alongside falling business sales throughout the lockdowns.
Net exports (+1.0ppt in Q3,-0.3 ppt yr) — Net exports added 1ppt to activity in Q3, reversing the drag seen in the previous quarter. The resumption of resources exports (3.0%q/q) from earlier weather-related disruptions drove a 1.2% rise in exports, partially rebounding from a 3.4% contraction in Q2. Exports were still 11.8% down on pre-pandemic levels weighed heavily by weakness in the service sectors (-47.8%), including tourism and education, due to the international border closure. Imports declined by 4% in the quarter due mainly to a 9.5%q/q fall in consumption goods. Constraints on global production hit new vehicle imports very significantly (-17.5%q/q) while the domestic lockdowns restricted demand generally. While goods imports were substantially higher than at the end of 2019 (7.3%), services imports were almost 60% lower over the period reflecting the prohibition placed on overseas travel. Overall, this leaves imports down 8.9% on pre-pandemic levels.
— — —
GDP — Q3 | Incomes: GDP (I) -1.8%q/q, 3.8%Y/Y
Real GDP income contracted by 1.8%q/q, slowing annual growth from 9.3% to 3.8%. The weakening in the economy associated with the Delta lockdowns drove a decline in national income, with nominal GDP contracting by 0.6% in the quarter. However, it remains substantially higher through the year (11.2%) and is 7.2% above its pre-pandemic level, supported by elevated commodity prices.
In Q3, the terms of trade ticked up by modestly by 0.5%, resetting to a new record high level. This follows a 23.1% surge over the past year as the global economic recovery effort has led to very strong demand for Australia's major resource commodities, pushing up prices as a result. More recently, though, iron ore prices have retraced from their highs, however; prices have advanced for other commodities, including LNG and coal.
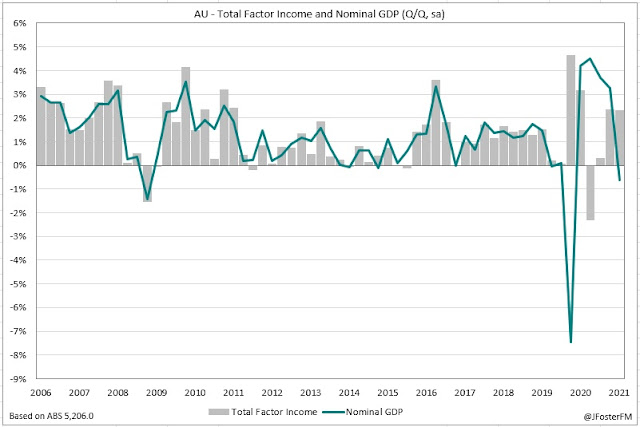
Given the lockdowns, a key dynamic in the quarter was income support from federal and state and territory governments. Total factor income (sum of income generated by employees, companies and unincorporated businesses) typically moves in line with changes in GDP. However, in Q3 total factor income lifted by 2.3% whereas nominal GDP contracted by 0.6%. The spread between these outcomes reflects the fiscal boost provided by governments to households and businesses.
With the recovery in the labour market upended by the lockdowns, compensation of employees slowed to growth of 0.5% in the quarter following strong gains in the previous 4 quarters. This saw annual growth easing to 4.7% from 6.3%.
Private non-financial corporations operating surplus lifted by 4.7%q/q driven by the mining sector on strength in LNG and coal prices, while the hospitality and construction industries were supported by government transfers. But small businesses were the main beneficiary of Covid-related subsidies, with gross mixed income surging by 8% in Q3. Financial corporations operating surplus increased by 1.3%q/q, taking growth through the year to a 4-year high at 4.7%.
— — —
GDP — Q3 | Production: GDP (P) -1.9%q/q, 3.8%Y/Y
The September quarter GDP production measure fell by 1.9%, with growth through the year stepping down from 9.6% to 3.8%. At a broad sector level, the steepest declines in output were seen in household services (-5.5%) and in goods distribution (-4%q/q) with lockdowns affecting these sectors the hardest. Both goods production (0.1%q/q) and business services were around flat in Q3. In the 2020 national lockdown, falls in output were much larger and more broad based, indicating the degree of adaptability Australian businesses have displayed around lockdown disruptions.
In the services sector, production fell by 2.4% in the quarter to be 0.9% below its pre-pandemic level. Within this, household services contracted by 5.5% in the quarter, leaving it 3.6% lower than at the end of 2019. Heavy falls were seen in the hospitality (-26.4%) and recreation (-7.5%) industries in Q3 as public health restrictions halted interstate travel and led to venue closures. The health care industry also weighed (-2.1%q/q) as elective procedures were canceled during the lockdowns. Business services eased 0.2%q/q but are up 1% on pre-pandemic levels. Financial services (1.3%q/q) expanded on superannuation changes and elevated household savings. This helped to attenuate declines in rental, hiring and real estate services (-1.2%) on reduced demand for tourism-related vehicle rentals and in administration & support services (-2.1%q/q) as demand for labour hire and travel agency services fell.
Goods sector production was down 1.3%q/q to be 1.7% below pre-pandemic levels. Lockdown restrictions drove a 4% fall in the good distribution sector, leaving it 3.3% lower than prior to Covid. In Q3, wholesale trade declined by 5.4% as fuel demand fell in the lockdowns and cuts to production resulted in lower sales for domestic vehicle dealerships. Meanwhile, retail trade fell 3.4% on pandemic restrictions and the transport industry contracted by 3.2% as domestic tourism was hampered by border closures. Goods production was flat in Q3 (0.1%) with a 1.7% rise in mining offsetting falls in manufacturing (-1.1%q/q) associated with input shortages and construction (-1.1%q/q) as work was disrupted by restrictions on sites.
— — —
GDP — Q3 | Prices
Economy-wide inflation through the GDP deflator slowed to a 1.4% rise in Q3 coming off faster increases in the prior two quarters. Annual growth has accelerated to 7.2%, its highest in 11 years. However, this is coming from a very weak base with the low of -0.1% reached a year earlier, and it is also reflecting the surge in the terms of trade over the period. The gross national expenditure deflator, which adjusts for the terms of trade impact, is running at a much more modest 1.9%Y/Y. Meanwhile, the household consumption deflator (a proxy for the CPI) was little changed at 1.8%Y/Y from 1.7% previously.

The effects of the Delta lockdowns were seen in the 5.4% plunge in hours worked across the economy in Q3, contracting to 3.9% below its pre-Covid level. Hours worked in the market sector fell more sharply, down 6.8% on the quarter and are also 6.8% lower than at the end of 2019. With these falls substantially larger than the decline in output (-1.9%), GDP per hour worked advanced by 3.7%q/q and by 5.3%q/q in the market sector.
— — —
GDP — Q3 | States
New South Wales state demand contracted by 6.5% in Q3 to be down by 3.4% on its pre-pandemic level. This compares with an 8.4%q/q fall in the 2020 national lockdown. Household consumption was crunched by 10.8%q/q as the lockdown hit hospitality and entertainment spending. The temporary suspension of construction work and associated restrictions led to a 5%q/q decline in dwelling investment. Business investment rolled over by -8.7%q/q in a severe loss of momentum to the earlier upswing. Disruptions to trade and restrictions saw both equipment spending (-13.4%q/q) and non-residential construction (-9.1%q/q) off heavily in the quarter. Public demand provided some offset with the pace lifting to lifting 3.2%q/q from 2.8%q/q in Q2.

Relative to NSW, the decline in Victorian state demand was a fairly modest 1.4%q/q despite also seeing a lengthy lockdown that extended over into Q4. Overall, state demand is down just 0.3% on pre-Covid levels. A 5.2%q/q fall in household consumption was the key dynamic, with spending at entertainment and hospitality venues and in clothing and footwear retail seeing the largest declines. However, all other components advanced in Q3. Residential construction activity lifted by 2.3%q/q coming off a weak Q2 (-0.6%). There was a solid 3.7%q/q rise in business investment, which is now up 16.3% through the year and 2.5% higher than at the end of 2019. Public demand lifted by 3.4%q/q in support of the state's vaccine rollout.
The other states saw only short periods of lockdowns or remained largely unaffected by Delta outbreaks in Q3. In Queensland, state demand softened slightly to 1.8%q/q from 2.0% in Q2 but was now 6.2% above pre-Covid levels. Household consumption growth was a modest 0.3%q/q (2.9%Y/Y). Residential construction activity is running at an incredibly robust pace (4.6%q/q, 27.6%Y/Y) in response to significant policy stimulus. Business investment (1.1%q/q) was supportive, while policy decisions in relation to Covid-19 response measures drove a 4%q/q rise in public demand. South Australian state demand lifted by 1.4%q/q, maintaining the rise seen in Q2 and advancing to 5.6% above pre-pandemic levels. Growth in household consumption was 0.3%q/q, supported by discretionary categories. Business investment surged (8.1%q/q) with engineering construction in a strong upswing (28.4%Y/Y). A 0.8%q/q lift in public demand was driven by spending associated with the vaccine rollout.

State demand in Western Australia posted a 0.6%q/q rise to be running 6.3% higher than end 2019 levels. In the quarter, household consumption increased by 1.9% with the state hosting a couple of major sporting events. However, the overall expansion lost some momentum during Q3 due to a softening in residential construction (-1.5%q/q), business investment (-2.6%) and public demand (-0.7%q/q). A 4.2%q/q rise left Tasmania state demand up 9.5% on pre-pandemic levels. Retail and services spending drove an overall 0.9%q/q rise in household consumption. Residential construction (23%Y/Y) and business investment (40.9%Y/Y) have clearly benefitted from the Covid-19 stimulus response. Meanwhile, the vaccine rollout drove a 4.8%q/q rise in public demand.