Independent Australian and global macro analysis

Friday, February 8, 2019

Weekly note (8/2) | RBA shifts to neutral

The Reserve Bank of Australia (RBA) was the key focus this week, highlighted by its shift to a neutral policy stance from its long-held mild tightening bias. The Governor's statement that accompanied Tuesday's decision to leave the cash rate on hold at 1.5% contained no clear indication of this forthcoming shift, though it did signal a lower growth outlook for the domestic economy, and also noted an increase in "downside risks" for global growth, the latter regarded by the Bank as the predominant headwind. 

Wednesday's speech (titled: The Year Ahead) by Governor Lowe to the National Press Club maintained a positive assessment of domestic conditions pointing to expectations for "reasonable" growth; further progress in the labour market; strong infrastructure investment; and ongoing contributions from resources exports. However, it was an increased level of uncertainty around the outlook for household consumption and the housing market that has driven the shift of the Board. 


The key line from the Governor regarding the cash rate was that "over the past year, the next-move-is-up scenarios were more likely than the next-move-is-down scenarios. Today, the probabilities appear to be more evenly balanced." This assessment replaced the line used in preceding communications that "members continued to agree that the next move in the cash rate was more likely to be an increase than a decrease". Financial markets were surprised by the shift, and as shown in our chart of the week (below) have now fully priced in an expectation for a rate cut by February of next year. 


Chart of the week

Friday's quarterly Statement on Monetary Policy for February contained a detailed analysis behind the changes to the Bank's assessment of conditions. Updated forecasts (see here) confirmed the RBA has lowered its outlook for growth in the domestic economy in 2019 to 3% from 3.25% and to 2.75% from 3% in 2020. The near-term growth outlook was revised more heavily; growth for 2018 was expected to slow to 2.75% (from 3.5%) before easing to 2.5% (from 3.25%) by mid-2019. The Bank regards trend growth to be 2.75% to maintain stability in unemployment and inflation.

The lower growth outlook is conditioned on household consumption growth slowing to 2.75%, revised down from its previous expectation for 3%. This, in part, reflects the impact of statistical revisions over recent years, though it was notable that the Bank is now prepared to allow for some downward impact on consumption growth from declining property prices. Growth in households' disposable income, which the Bank regards as having a greater impact on consumption growth, was also expected to increase by around 2.75%.


The other main downside risk comes from a sharper slowdown in residential construction activity. The Bank now expects dwelling investment to contract by 4.5% (from -2.4%)  in 2019 and by 5.3% (from -2.4%) in 2020, which acknowledges an increasing deterioration in building approvals and tighter financing conditions.

The Bank expects growth in the domestic economy to be driven by business investment, supported by non-residential construction and a gradual lift in mining investment, public demand in infrastructure and services, and resources exports. Stronger-than-expected conditions in the labour market were also positive, while wages growth was forecast to lift gradually.   

In line with the slower growth outlook, the Bank adjusted its outlook for the unemployment rate, which is expected to take a little longer to tighten below 5%, while the pace of employment growth in 2020 was revised lower. Accordingly, inflation is now forecast to return to within the 2-3% target band in 2020 — a year later than previously expected — though weaker oil prices and slower increases in utilities and other administered prices were contributing factors.   

The key developments the RBA will be focused on this year are around the household sector, notably the impact of declining property prices on spending decisions, housing market activity, labour market conditions, and rising uncertainties abroad. 

In other local events, the domestic data flow remained decidedly disappointing this week. Building Approvals contracted by a sharp 8.4% in December, with weakness evident across all dwelling types (read our analysis here). The deterioration in building approvals gathered pace over the second half of last year and points to an increased risk of residential construction becoming a headwind to growth in the domestic economy over the next couple of years. Retail spending slowed at a sharper-than-forecast pace in December, posting a decline of 0.4% (see here). Though seasonality did appear to impact the result, the detail also contained indications of softening dynamics around the consumer, potentially in response to ongoing declines in property prices, while retail volumes increased by just 0.1% in the quarter pointing towards a subdued contribution from household consumption to GDP growth in Q4. International trade data for December showed a greatly increased trade surplus in the month, though that was driven by weaker outcomes for both exports and imports (see here). With stronger commodity prices over the quarter resulting in a boost to the nation's terms of trade, a reduced contribution to growth from international trade in Q4 appears likely.

Also this week, the final report of the government inquiry into the nation's banking and financial services sector was released. The key recommendations of the report tabled by Commissioner Kenneth Hayne were focused around enhancements to the regulatory environment, with ASIC and APRA set to be overseen by a newly-established independent body. Wide-sweeping changes to overhaul fee structures across the financial services industry were recommended, though report contained no recommendation for an enforced separation for providers of both advice and wealth products. From a macro perspective, Commissioner Hayne indicated that no further changes to tighten existing lending laws were required, noting the improved compliance measures already taken by the banks in this area.


— —

It was an unusually quiet week for global markets with few major events or data releases on the calendar. Market closures for Chinese New Year holidays also kept Asian trade thin across the week.

The European Commission lowered its forecasts for economic growth in the 19-nation euro area for 2018 (from 2.1% to 1.9%), 2019 (from 1.9% to 1.3%) and 2020 (from 1.7% to 1.6%), reflecting weaker output from global trade, contracting car production in Germany and social and political tensions. Sharp downgrades were expected in Germany, the euro area's largest economy, where growth is forecast to slow to 1.1% in 2019 mostly in response to major changes occurring in the auto sector to meet emission targets that have impacted output, and also in Italy, the third-largest euro area economy, where uncertainty over government fiscal policy was expected to restrain growth to just 0.2% over the year. Weaker oil prices also resulted in inflation forecasts declining to 1.4% (from 1.8%) this year before lifting modestly to 1.5% (from 1.6%) in 2020.

The Bank of England maintained policy settings in line with expectations at its latest meeting on Thursday. The key development was that the Bank sharply lowered its forecast for growth this year from 1.7% to 1.2%, which would be the slowest pace since the financial crisis, and from 1.7% to 1.5% in 2020. The Bank highlighted "an intensification of Brexit uncertainties" as having notable impacts on business investment and exports. 

Sentiment around a global trade resolution turned down this week when US President Trump confirmed he did not plan to meet with China's President Xi before March 1, which is the deadline to reach a trade deal to prevent an increase in the tariff rate from 10% to 25% to US$200bn of Chinese imports to the US.  


Tuesday, February 5, 2019

Australia's trade surplus surges in December; details soft

Australia posted its second-highest monthly trade surplus on record according to ABS data for December, though the underlying detail was soft with exports moderating and imports contracting sharply. The Bureau also reported that its preliminary estimate for the nation's trade surplus in Q4 was in the order of 47% higher than in Q3, after allowing for seasonal adjustments. 


International Trade — December | By the numbers
  • The trade surplus increased by $1.425bn in December to $A3.681bn, vastly ahead of the median forecast for $2.225bn. November's initially reported surplus of $1.925bn was revised up to $2.256bn in today's update.
  • Export earnings declined by $634m, or by -1.6%, in December to $A37.924bn, with annual growth at 16.2% (prior rev: +1.2%m/m, +21.2%Y/Y) 
  • In comparison, the value of goods and services imported fell by a sharper $2.058bn, or by -5.7%, in the month to $34.244bn, which saw annual growth plummet to -0.9% (prior rev: +1.3%m/m, +14.2%Y/Y)


International Trade — December | The details 

Australia's export earnings declined by a relatively modest 1.6%, or $634m, in December, which was accentuated by a sizeable fall (-57%m/m, or -$1.034bn) in the often volatile non-monetary gold category. However, earnings from rural goods exports increased by 9.5%, or $353m, to $4.056bn, driven by cereals. Non-rural goods were little-changed rising by just 0.1%, or by $33m, to $25.061bn. 

The non-rural goods category includes the major commodity exports (iron-ore, coal an LNG), which were all softer in December. This was mitigated by gains from metals, transport equipment, and machinery.

Services exports were broadly-flat in December at +0.2%, or +$16m, to $7.982bn. This was driven by 'other services' rising by $15m to $2.079bn, while tourism was essentially unchanged at $5.507bn.        


For imports, the 5.7% decline in the total for December was the sharpest monthly contraction since February 2012. In nominal terms, the $2.058bn decline was broad-based across; capital goods (-$1.070bn) and consumption goods (-$653m), while 'intermediate goods' used in production also fell (-$717m). These contractions were particularly sharp given their recent upward trends (see below). Service imports lifted by 3%, or by $222m, to $8.510bn in a result that was driven by overseas tourism (+$295m).   


December's trade surplus of $3.681bn follows surpluses from October ($2.285bn) and November ($2.256bn) coming to a total of $8.222bn for Q4, up from $6.248bn in the previous quarter. However, the ABS advised that after seasonal adjustments, its preliminary estimate for Q4's trade surplus was $8.506bn, which is an increase of $2.712bn (+46.8%) over the quarter.    

International Trade — December | Insights 

While the trade surplus in December vastly exceeded expectations, the underlying detail was disappointingly soft given that it was driven by a sharp contraction in imports with exports also declining, though the magnitude was not nearly as severe. The estimated increase in the trade surplus over Q4 is sizeable, however; last week's International Trade Price Indexes data indicates this may have been driven by stronger prices, particularly for key commodity exports, with the terms of trade potentially up by around 3.8% in the quarter. While positive from an income perspective, net exports within GDP calculations reflect volumes. Net exports added 0.3ppt to economic growth in Q3, though a reduced contribution appears likely for Q4.          

Monday, February 4, 2019

Australian retail sales decline in December

Australian retail sales declined in the lead-up to Christmas, with data released by the ABS showing a much weaker-than-expected outturn relative to market expectations. This followed an upwardly revised increase in turnover in the previous month that was driven by online promotional activities for Black Friday. A similar trend occurred in 2017, indicating that sales promotions in November may be resulting in retail spending being brought forward ahead of Christmas. 


Retail Sales — December | By the numbers
  • Retail spending fell by $104.3, or by -0.4%, in December to $A27.006bn, with the median forecast set at a flat (0.0%) outcome. Turnover growth in November was revised up to 0.5% from 0.4%.   
  • Annual turnover growth remained at 2.8% in December on a seasonally-adjusted basis, however; in trend terms, sales growth slowed from 3.4% to 3.2% in year-on-terms. 
  • Retail volumes which adjust nominal sales for price changes and are a key input to household consumption within GDP calculations — increased by 0.1% in Q4, well below the market forecast for a 0.5% rise.
  • On an annual basis, volume growth slowed from 2.3% to 1.6% in Q4


Retail Sales  December | The details 

Analysis of spending across the categories shows that it was weakness in the discretionary areas that drove the overall decline in December. Recall that it was these areas such as; clothing and footwear, household goods and department stores that drove the 0.5% increase in retail spending in November. Note also that online spending as a percentage of total turnover contracted by a sharp 1ppt to 5.6% in December. Going back to 2017, there was a 0.7ppt decline in this figure between November and December. This adds support to the view of a 'bringing forward' in spending ahead of Christmas to capitalise on sales promotions around Black Friday. 


The detail for December was; food +0.5%, household goods -2.8%, clothing and footwear -2.4%, department stores -1.1%, other -0.1% and cafes and restaurants +1.1%. Removing the food category to isolate discretionary spending, turnover ex-food fell by 1% in the month following a 0.6% rise in November.

Over Q4, retail turnover in nominal terms increased by 0.7%, with all categories rising except for cafes and restaurants (-0.1%). Turnover ex-food in Q4 also lifted by 0.7%, driven by clothing and footwear, household goods and department stores. 

A different picture emerges when looking at the past 12 months, with total retail spending growing at a 2.8% pace compared to discretionary spending at 1.9%. To be clear, growth in retail spending at 2.8% is well below the rolling-decade average of around 3.7% in seasonally adjusted terms. Over the past year, the food and 'other retail', which includes pharmaceuticals and cosmetics, categories have driven overall retail spending. 


Turning to the states, December was a weak month across the board with; New South Wales -0.6%, Victoria -0.5%, Queensland -0.1%, South Australia -0.3% and Tasmania -0.2%. Western Australia was little changed at +0.1%. The key point to highlight is in New South Wales where spending declined by 0.5% in Q4 and only lifted by 1.7% over the past year. This may point to some response to declining property prices given that the state has a very low unemployment rate (4.3%) and solid population growth (1.5%).  


From a volume perspective, the 0.1% rise in Q4 was a disappointing result, while annual growth slowed back to a similar pace from the period between late 2016 and early 2017. Households continue to be impacted by slow wages growth, though strengthening labour market conditions have been supportive. Contributing to a softening dynamic for consumers has been the well-documented declines in property prices, which could be weighing on spending decisions, though that is a contentious and difficult link to confirm as yet.

In Q4 retail prices lifted by 0.6% — its fastest increase since the September quarter in 2016 — while the annual pace remains subdued at 1.4%. Intense competition and the increased presence of global online retailers have contributed to pricing softness in the sector in recent years, however; prices appear to be gently increasing.     

   
Retail Sales  December | Insights 

Though there does appear to be some seasonality at play, this was a much weaker-than-expected result in terms of both nominal spending and volumes. Broadly, this fits with a notable slowing in the domestic data flow recently. In particular, today's data will add to concerns around the household sector, which is the largest component of the domestic economy, amid slow wages growth and a potential negative wealth impact from declining property prices. These data contribute around 30% to household consumption in the National Accounts, with spending on services the largest component.

Sunday, February 3, 2019

Australian building approvals fall sharply in December

Australian building approvals fell to their lowest in 5½ years in December after recording another sharp decline in the month. For 2018, the total number of approvals was a little above 212,000  its lowest since 2014  as the deterioration accelerated over the second half of the year with broad-based weakness across all dwelling types. 

Building Approvals — December | By the numbers
  • Total dwelling approvals (including the private and public sectors) declined by -8.4% in December to 13,995 in seasonally-adjusted terms, vastly short of the market forecast for a 2.0% rise. After revisions, approvals fell by 9.8% in the previous month compared to the 9.1% decline initially reported by the ABS
  • In annual terms to December, total approvals fell by 22.5% (prior rev: -33.5% from the initial estimate of 32.8%)
  • Unit approvals contracted by 18.6% in December to 4,752 — its lowest total since July 2012 — with the annual decline at -38.0% (prior rev: -18.8%m/m, -54.3%)
  • House approvals declined by 2.1% in the month to 9,244 — the lowest since October 2013 — with the annual decline steepening to -11.1% (prior rev: -3.0%m/m, -7.5%Y/Y)

Building Approvals — December | The details

The deterioration in building approvals continued to gather pace towards the end of 2018. Over Q4, approvals declined by 10.9% to 46,206, which was its fourth consecutive quarterly contraction and the lowest quarterly total since Q2 2013.  


Looking into the underlying details, approvals for all types of dwellings have deteriorated. While mostly led by high-rise units (-28.5%q/q), approvals for houses (-8.7%q/q), townhouses (-16.3%q/q) and low-rise units (-10.4%q/q) all weakened over the quarter, as shown below. 


In another concerning trend, the weakness in approvals has been broad based across the nation. Only South Australia (+5.6%) and Western Australia (+1.1%) saw approvals rise in December, while there were sharp declines in New South Wales (-8.6%), Victoria (-8.1%), Queensland (-5.8%) and Tasmania (-24.3%). 

For Q4, there were double-digit declines in New South Wales (-14.2%), Queensland (-16.7%), South Australia (-11.5%) and Western Australia (-13.7%). Victoria fell slightly by 1.3%, while Tasmania posted a 6.6% rise.   


The granular detail provided in the table, below, indicates mixed results for house approvals across the states in December, while the deterioration for units continued. 


Highlighting the nation's two-largest capital cities, unit approvals have fallen sharply across the past year; Melbourne down by 52.8% and Sydney by -31.6%. House approvals in Sydney are -16.7%Y/Y, but a comparatively modest -3.0%Y/Y in Melbourne.

In slightly better news, the value of renovations approved increased by 3.1% in December and appear to be gently on a positive trend. The value of non-residential approvals, which are highly volatile month to month, fell by 9.8% in December.    


Building Approvals — December | Insights

Building approvals trended lower over 2018, with the deterioration accelerating over the second half. Factors contributing to the weakness include declining property prices, tighter financing conditions and a highly-elevated level of work already in the pipeline. Over recent months, it has appeared likely that residential construction activity would ultimately turn negative towards economic growth. The acceleration in the deterioration in building approvals is clearly a concerning development and slowing residential construction is likely to add to the headwinds facing the domestic economy in 2019. 

Friday, February 1, 2019

Weekly note (1/2) | Patient Fed; Australian inflation subdued

There was an array of key events for markets both globally and locally this week. Starting abroad, the highlight was the latest policy meeting from the US Federal Reserve. The Federal Open Market Committee decided as widely expected to maintain its benchmark interest rate at a range of 2.25-2.5%, while its communication extended its recent dovish tilt.

The Committee continues to hold underlying confidence in the outlook for the US economy and in the labour market, however; risks posed by slowing momentum in the global economy,
 notably in China, trade and political uncertainties, including the US government shutdown, and volatility in financial markets warranted the Committee being "patient as it determines what future adjustments to the target range for the federal funds rate may be appropriate". Consistent with this, the line that "some further gradual increases" in the fed funds rate was removed from the statement.    

The existing projections of the Committee point to 2 rate increases this year, but the risks appear to be slanted the downside given the caution around the outlook. Though the prospect of rate increases cannot be ruled out, the data — namely inflation  will need to provide the Committee with clear justification to do so. Financial markets have, however, priced out expectations for any further rate increases in this cycle, moving towards the chance of a cut in 2020. Sentiment was also buoyed by separate communication that indicated that the Fed would be prepared to adjust the pace of its monthly balance sheet run-off, providing more liquidity in markets, if economic conditions required a more accommodative policy stance. 

In Europe, economic growth in the 19-nation euro area slowed in line with market expectations in the December quarter from 1.6% to 1.2% in annual terms. As yet, the detail was lacking given this was the first of three estimates, though it was confirmed that Italy — the third-largest economy in the euro area  had entered into a technical recession with growth contracting for the second consecutive quarter. Momentum in economic activity in the euro area has been slowing due to weakening business investment, impacted by Germany's auto industry facing major changes in response to stricter emissions standards, and external demand due to trade tensions, while a loss of confidence stemming from political uncertainties has also contributed. In spite of this, the euro area's unemployment rate held at a decade-low 7.9% in December, unchanged from the previous month. 

Brexit was back in focus with a series of parliamentary votes taking place on Tuesday, though once again little substantive progress was made towards the UK securing a withdrawal agreement with the European Union. A proposal put forward by an opposition MP in an attempt to cede control of the Brexit process from PM Theresa May to the parliament, potentially giving rise to a delay in the withdrawal under Article 50, was rejected. A motion introduced by a conservative MP indicated that parliament would support PM May's Brexit proposal if the contentious Irish backstop was replaced by unspecified "alternative arrangements", however EU officials again rejected such a proposal. The Irish backstop intends to maintain an open border between Ireland (EU) and Northern Ireland (UK), but many MP's fear that it will lead to different trade regulations applying to Northern Ireland compared with the rest of the UK. In a non-binding vote, the parliament signaled their opposition to leaving the EU under a no-deal scenario, but this remains the default situation unless the impasse can be resolved before the March 29 deadline. 


— — —

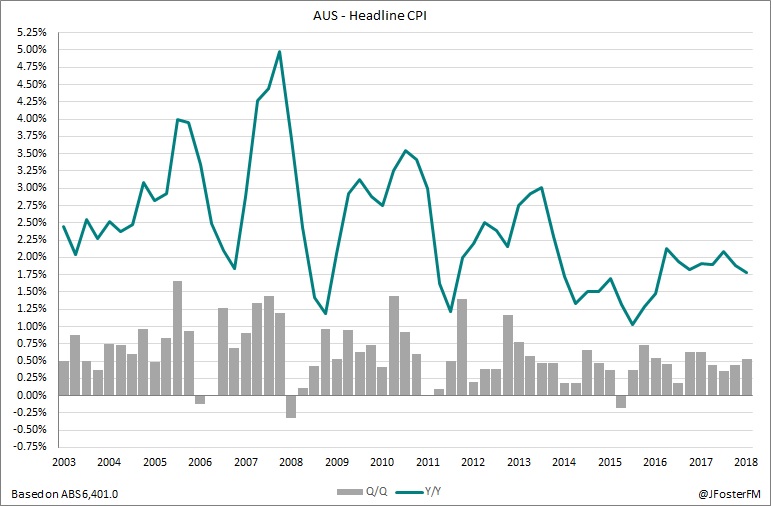
The highlight from a local perspective this week was the Q4 Consumer Price Index data (see our note here). Australian inflation continues to remain subdued, with the core measure meeting expectations at 1.77% in annual terms in Q4 but has now tracked below the Reserve Bank of Australia's 2-3% target range for three years, as shown in our chart of the week. 


Chart of the week


Soft pricing pressure has been persistent over recent years reflecting a subdued pace in wages growth with excess capacity in the labour market at elevated levels. The nation's unemployment rate has been declining for much of the past year with employment growth running well above the rate of growth in the labour force, however; improvement in broader measures of underutilisation has been marginal. 

In Q4, the headline increase of 0.5% was stronger than anticipated for the first time in 2 years, though the detail indicated there was little sign of a shift in the inflationary pulse. The main contributor driving inflation remains tobacco, which is subject to legislated price increases, while seasonal impacts led to higher fruit prices in the quarter and drought conditions impacted meat prices. Inflation driven by market-based forces and impacting key areas such as rents, new dwellings, retail goods and household services remained broadly soft in the quarter.


From a policy perspective, the RBA has been prepared to be patient with below-target inflation, conditioned on the expectation that a tightening labour market will gradually lead to stronger wages growth and inflationary pressures. Next week, the Bank publishes its latest set of economic projections where it is likely to indicate a similar trajectory for inflation over the next couple of years to its previous forecasts from November, which point to a return to the target range by the end of 2019. 


The NAB's Business Survey for December generated significant attention this week, which showed a dramatic fall in business conditions in the final month of 2018 to a below-average reading of +2 from +11 in November — the largest monthly decline since the financial crisis. Meanwhile, business confidence declined over Q4 and held at a below-average level of +3 in December. 


Though the NAB highlighted caution given the timing of the survey, the declines in conditions had been broad-based across the sub-components (trading, profitability, and employment) and industries; part of a weakening trend since the start of 2018 and indicative of notable slowing in business activity from much higher levels over the second half of the year. The decline in the employment sub-component from +9 to +4 is particularly significant, with the NAB assessing this to be consistent with an easing in the pace of employment growth from around 22,000 per month to around 18,000 per month. The labour market requires the addition of around 20,000 jobs per month to prevent the nation's unemployment rate from rising, depending on changes in participation. Also important to highlight was that the forward orders component fell to -1 from 0, pointing to a slowing in demand and activity.


Lastly, property prices on a national capital-city basis contracted by a further 1.2% in January taking the annual decline to 6.9% according to CoreLogic's Home Value Index. Price falls continue to be led by Sydney (-1.3%m/m, -9.7%Y/Y) and Melbourne (-1.6%m/m, -8.3%Y/Y), though all other capitals excluding Canberra recorded declines in the month. An acceleration in price declines follows tightening lending standards, with data compiled by the RBA showing a further easing in the pace of housing credit growth in December to a 5½-year low.  

Wednesday, January 30, 2019

Australian inflation remains below target in Q4

Australia's Consumer Price Index (CPI) came in around market expectations in Q4, though economy-wide pricing pressures remain soft. Core inflation, which excludes price changes in volatile items, printed at 1.77% in year-on-year terms in Q4 and has remained persistently below the 2-3% range targeted by the Reserve Bank of Australia (RBA) since 2015, largely reflecting the impact of slow wages growth associated with an elevated level of spare capacity in the nation's labour market. Today's outcome was in line with the RBA's forecast for Q4, with the Bank expecting inflation to rise gradually within target over the next couple of years. The RBA is scheduled to release updated growth and inflation forecasts next week. 

Consumer Price Index — Q4 | By the numbers 
  • Headline inflation was 0.5% in Q4, ahead of the market forecast for 0.4% and the first upside result in 2 years (prior: 0.4%). 
  • Annual headline inflation at 1.8% was also ahead of the median forecast for 1.7%, but down from the 1.9% pace in Q3. 
  • Core inflation (average of the trimmed mean and weighted median measures) was 0.4% in Q4, compared to the market forecast for 0.45% (prior rev 0.37% from 0.32%)
  • Annual core inflation was 1.77%, in line with expectations for 1.75% (prior rev 1.8% from 1.75%)     


Consumer Price Index — Q4 | The details 

Looking across the categories, the quarterly and annual price changes are shown in the chart, below (click to expand). The alcohol and tobacco group saw a 3.2% rise in the quarter (6.8%Y/Y), with tobacco prices up by a sharp 9.4% in Q4, following a 12.5% increase in the federal excise tax. 

Recreation and culture lifted by 1.1% (1.7%Y/Y) following a 6.2% increase in the cost of domestic holiday travel, which as the ABS highlighted coincided with the October school holiday period and the lead up to the peak season over summer. 

Food and non-alcoholic beverages posted a 0.9% rise in Q4 (1.5%Y/Y), which incorporated seasonal impacts in fruit prices (+5%q/q), while meat prices (+1.6%q/q) lifted in response in drought conditions. 

In the key housing category, the quarterly rise of 0.2% was another soft outcome (1.5%Y/Y). There were subdued increases for both rents (+0.2%) and new dwelling purchases by owner-occupiers (+0.4%).   

The main drag on prices in Q4 was from a 0.7% fall from the transport group (2.8%Y/Y), which mostly reflected weaker global oil prices flowing through to petrol prices declining by 2.5% in the quarter.

Cyclical effects reducing out-of-pocket expenses for pharmaceuticals under the Federal government's Pharmaceutical Benefits Scheme saw the health group decline by 0.4% in the quarter (3.3%Y/Y).

Clothing and footwear eased by 0.2% (-0.7%Y/Y), which followed increases in the previous two quarters are a lengthy period of 6 consecutively quarterly declines. The intensity of retail competition and widespread discounting have been key factors in pricing weakness. This has also impacted furnishings and household equipment, though prices in these areas were firmer in Q4.


The contributions of the groups to the quarterly headline CPI result are shown in the chart, below. 


Overall, inflation continues to be driven by areas in which prices are impacted by aspects of government policy such as alcohol and tobacco, utilities, health, education, and property rates. The chart, below, highlights that inflationary sources from the private sector as measured by market goods and services ex-volatile items continue to lag the broader CPI index. However, market-based sources jumped by 0.7% Q4 to 1.5%Y/Y — its fastest annual pace in 3 years — after being stuck at 1.1%Y/Y for the past 4 quarters.       


Inflation also continues to be driven largely by domestic-based factors. Non-tradables lifted by 0.9% in Q4 (2.4%Y/Y) reflecting the increases in tobacco costs and in domestic holiday travel. Tradables — goods and services where prices are determined on global markets — fell by 0.3% in the quarter (0.6%Y/Y) following the weakness in petrol prices and also in audio, visual and computer equipment. 


Consumer Price Index — Q4 | Insights 

Today's data continued to show a soft inflationary pulse in the domestic economy and in that sense it was broadly consistent with the CPI reports from recent quarters. Inflation continues to be driven mostly by areas impacted by government policy, and in particular, tobacco remains a key driver. Sources of inflation remain subdued in housing and in clothing and footwear, though household goods have firmed as a possible response to a weaker Australian dollar. Household services have also been weakened by changes to child care subsidies. The RBA forecasts a gradual lift in inflation over the next couple of years in response to a tightening in the labour market and given that Q4's data was broadly in line with their expectations, next week's updated forecasts are not likely to be revised too significantly from an inflationary perspective. 

Friday, January 25, 2019

Weekly note (25/1) | Slower growth as global risks rise

An outlook for slower economic growth due to rising risks from an array global uncertainties was the key theme in markets this week. While this already the base case for markets in response to slowing momentum in forward-looking indicators of activity and in weaker-than-expected incoming economic data, policymakers and authorities have increasingly shifted towards the market in this assessment.   

This week, the International Monetary Fund (IMF) lowered their forecast for global economic growth in 2019 from 3.7% to 3.5% and from 3.7% to 3.6% in 2020, citing factors from US-China trade tensions, tighter financial conditions, and political uncertainty. There were few signals as to how and for how long these uncertainties might play out during this week's World Economic Forum in Davos, with President's Trump, Xi and Macron and UK Prime Minister Theresa May notable absentees all facing more immediate concerns back at home. 

The slowing in the IMF's global growth outlook mostly referenced deteriorating conditions in the euro area. Germany, the largest economy in the region, has been impacted by a weakening in production, particularly from its blue-chip auto sector in response to recent emissions targets for new cars set by the European Union, and by trade uncertainties. Italy's economy is also weighing on the outlook due to political uncertainty and from the financial risks posed by its heavy level of national debt.

Remaining with Europe, the latest policy meeting of the European Central Bank (ECB) held during the week described the risks to the outlook as having "moved to the downside" compared to the assessment from December of "broadly balanced" but "moving to the downside"; a subtle but clear shift in the assessment of the growth outlook. ECB President Mario Draghi was clear that the Governing Council did not discuss policy options at this meeting and will be attempting to gain further clarity over its assessment of the outlook ahead of the March meeting where it will publish its updated forecasts. For now, the Governing Council's underlying assessment is that despite a near-term expectation for a weakening, the growth outlook is underpinned by favourable financial conditions, a strengthening labour market leading to stronger wages growth and an ongoing but somewhat slower expansion in the global economy. 

Developments in China were also of significance this week. Growth in China's economy slowed from 6.5% to 6.4% over the year to the December quarter, its slowest expansion since the global financial crisis around a decade ago, while growth over the calendar year was 6.6%. Chinese officials had targeted growth of 6.5% in 2018. The mild deceleration in growth comes amidst headwinds from trade tensions, a softer global economy and also the impact of longer-term structural reforms, which aim to set growth on a more sustainable path by addressing factors such as financial stability risks and reducing excess industrial capacity to improve production quality and environmental outcomes. Policy measures to help support growth include reductions to banks' reserve requirements to boost liquidity, tax cuts and infrastructure investment. 

The data flow was restricted in the US again this week, however; US President Trump as of Saturday morning announced a temporary deal had been reached to reopen the government for 3 weeks without securing border wall funding from the Democrats. The agreement comes after a 35-day partial shutdown of US government agencies.  


— — —

Signs of a slowing growth outlook were also evident in Australia this week. Westpac-Melbourne Institute's Leading Index fell to a reading of -0.27% in December from +0.42%, which provides an indication for growth in the domestic economy to slow below its potential pace of around 2.75%Y/Y over the next three to nine months. In Q3, output growth slowed from 3.1% in annual terms to an around-trend pace of 2.8%.      

The Leading Index reflects changes in a range of economic and financial market data points, with the deterioration in December pointing to headwinds for the domestic economy, which according to Westpac's Chief Economist Bill Evans include; a negative wealth impact on households' balance sheets from declining property prices, slowing residential construction activity and lower employment growth and investment from the business sector due to political uncertainty and heightened volatility in markets.


The Reserve Bank of Australia (RBA) next meets on February 5, which will be keenly anticipated given that much has changed globally since the Board last met in December. Over the summer, communication from other major central banks  including in the US, Europe, UK and Japan  has acknowledged rising uncertainties in the global economy and the potential headwinds to the growth outlook. 


According to the RBA's most recent forecasts, growth in the domestic economy is anticipated to increase at an above-trend pace of 3.5% in 2018 and by 3.25% in 2019, while its guidance is that "... the next move in the cash rate was more likely to be an increase than a decrease, but that there was no strong case for a near-term adjustment in monetary policy". Financial markets have continued to price out expectations for a rate increase over the next 18 months and will be looking to the Governor's statement at the February meeting for signs of a shift from the Board in their assessment of conditions both at home and abroad. 


Against a softening outlook, the key data event of the week showed ongoing strength in Australia's labour market. For the third consecutive month, employment posted a stronger-than-forecast result with a 21,600 increase in December, while the nation's unemployment rate lowered from 5.1% to 5.0% (see our full analysis here). 


In 2018, Australia's labour market performed stronger than anticipated as employment increased by 268,600. As highlighted by our chart of the week, the momentum was maintained towards the back end of the year, with employment increasing by 87,300 over Q4, which was an outperformance of 29,300 relative to market expectations. 


Chart of the week

Over the near term, the outlook for the labour market is supportive given that employment growth is tracking at a robust 2.1% annual pace and ahead of growth in the working-age population (around 1.7%Y/Y). However, factors that could slow the pace of employment growth and place upward pressure on the nation's unemployment rate over 2019 are a likely downturn in residential construction activity and increasing uncertainty from the upcoming federal election and from global developments. 

Wednesday, January 23, 2019

Australia's labour market remains stronger than expected

Australia's labour market posted a stronger-than-expected rise in employment in December as the nation's unemployment rate declined to its lowest level mid-2011. Despite a deterioration in other economic indicators recently, labour market conditions remain strong and will be a key support to the household sector, though the pace of wages growth remains low.


Labour Force Survey — December | By the numbers
  • Total employment increased by 21,600 in December, outpacing an expected rise of 18,000 (prior revised: 39,000 from 37,000)
  • The unemployment rate fell by 0.1ppt to 5.0%, which was an upside surprise to the market expectation for no change from 5.1% (unrevised from the previous month)
  • Measures of spare capacity decreased in December; underutilisation rate fell by 0.2ppt to 13.3%, and the underemployment rate declined by 0.1ppt to 8.4%
  • The participation rate fell by 0.1ppt to 65.6%, against an expectation for it to hold at 65.7% (unrevised)
  • Hours worked were a fraction higher in December, rising by 0.1% to 1.759bn hours (+1.5%Y/Y). (Prior revised: -0.3%m/m, +1.1%Y/Y) 


Labour Force Survey — December | The details 

Analysis of December's data shows that the rise in employment of 21,600 came entirely from the part-time category, which increased by 24,600, while full-time work declined by 3,000. In Q4, total employment lifted by 87,300 led by part-time at 58,500 compared to 28,800 gain in full-time. However, in 2018, total employment increased by a solid but not spectacular 268,600, which was driven by full-time at 162,000, with part-time adding 106,600.  

Australia's labour force increased marginally by around 7,500 in December, which equated to a decline in the nation's participation rate of 0.1ppt to 65.6%. This followed a large increase of 49,900 in the previous month that saw the participation rate jump by 0.2ppt to 65.7%. 

With the 21,600 gain in employment outpacing the 7,500 new entrants to the labour force, the total of unemployed fell by 14,100 to 666,700. To 2-decimal places, the national unemployment rate eased from 5.09% to 4.98% on a seasonally-adjusted basis — its lowest since June 2011. Though if taken at the standard 1-decimal place, the unemployment rate fell by 0.1ppt to 5.0%, taking it back to level from October. In trend terms, the unemployment rate remained at 5.0%, which is also its lowest since June 2011. 

Importantly, while employment growth slowed notably in 2018 it remains at a robust pace of 2.1% in annual terms and exceeds the rate of growth in the working-age population of around 1.7%Y/Y. Forward-looking indicators from private surveys continue to point to employment rising by around 20,000 per month, which is broadly sufficient to prevent the nation's unemployment rate from increasing. 


Despite a positive near-term outlook for the unemployment rate, measures of excess capacity remain elevated and have proved harder to bring lower. However, both the unemployment rate (includes those employed but wanting more hours) and the underutilisation rate (includes the underemployed and the unemployed) improved marginally in December. Lowering excess capacity is key to generating a faster pace of wages growth.  


At the aggregate level, hours worked ticked up by 0.1% in December and by 1.5% over 2018. Though, after adjusting for the increase in employment, average hours worked at an individual level continues to trend lower at 138.3 hours in the month. 


Across the states, Victoria was the standout as its unemployment rate fell by 0.3ppt in December to 4.2% — its lowest since August 2008. Victoria also led employment growth in 2018, accounting for 120,200 of the 268,600 new positions added nationwide. In New South Wales, the unemployment rate held at 4.3%, while the state contributed 94,300 to total employment in 2018.

Both Queensland (-0.2ppt to 6.1%) and Western Australia (-0.2ppt to 6.3%) saw much-needed declines in their unemployment rates. Employment was fairly solid in Queensland in 2018 but fell in Western Australia. South Australia's unemployment rate spiked from 5.3% to 5.9% and Tasmania's edged up to 5.9%. In 2018, employment growth in South Australia lifted by 1.6% and fell by 1% in Tasmania. 


Labour Force Survey — December | Insights 

Australia's labour market performed solidly in 2018. In particular, Q4 was much stronger than anticipated with employment rising by 87,300 — an outperformance of a little above 29,000 relative to market expectations over the quarter. Strength in the labour market is a bright spot in the domestic economy amid a range of other indicators pointing towards a slowing growth outlook in 2019. This could weigh on the pace of employment growth over 2019 due to a likely slowing in residential construction activity, while the upcoming federal election could also create uncertainty. As it stands, however, employment growth remains solid and above growth in the labour force, which will help to maintain the nation's unemployment rate around its existing level over the near term.