Independent Australian and global macro analysis

Thursday, October 4, 2018

Australian trade surplus holds strong in August

Australia recorded its 8th consecutive monthly trade surplus in August, with the result also exceeding the market forecast. The trade surpluses from July and August are tracking above the level from the 2nd quarter where international trade contributed modestly to economic activity.   

International Trade — August | By the numbers 
  • Trade surplus in August was $A1.604bn, which was stronger than the market forecast for a surplus of $1.45bn. July's trade surplus was lowered slightly from the initial estimate of $1.551bn to $1.548bn
  • The change in the monthly trade balance was +$56m (prior -$571m)
  • Export credits increased by 0.5%m/m to $A36.562bn, with annual growth increasing to 15.3%
  • Import debits increased by 0.4%m/m to $A34.958bn, which is 12% higher than a year ago

International Trade — August | The details

Looking at the details, Australia's export earnings increased by $185m, or 0.5%, in August to $36.562bn. Within this; non-monetary gold contributed $228m, rural goods (meat, cereal, and wool) $134m and services $45m however, non-rural goods fell by $222m. 

The decline from non-rural goods was impacted mostly by weakness from iron-ore and coal, which looks to be influenced by lower volumes, although this was moderated by a strong increase from 'other mineral fuels' of $166m, which is supported by LNG exports, and 'other non-rural' (sugar, honey and beverages etc) rising by $151m. 

Earnings from services exports lifted by $45m in August to $7.611bn, with tourism contributing $28m towards the overall increase.

Australia's import bill increased by $130m in August to $34.958bn, which represented a lift of 0.4%. In line with business investment trending up, imported capital goods have been rising the increase in August was 9% ($569m), although that was impacted by a sharp increase in civil aircraft. Consumption goods imports also lifted modestly, rising by $32m in August. Those gains were moderated by a $264m decline in intermediate goods, which was led by fuels and lubricants.   

Meanwhile, services imports rose by $83m to $8.094bn on the back of an $81m increase in tourism-related services, which includes business, education-related and personal travel. 

International Trade — August | Insights

August's trade surplus was another strong result. Averaging the past 2-months, the trade surplus is around $1.58bn and is tracking ahead of Q2's average of $1.28bn. This is reflective of stronger prices for key commodities, but this is moderated by some softness in export volumes of iron-ore and coal. International trade added 0.1ppt to GDP growth in Q2 and at this stage, another broadly flat result appears likely for Q3, with some risk of a subtraction.  

Wednesday, October 3, 2018

Australian building approvals slow sharply in August

Slowing Australian building approvals accelerated in August following a sharp decline in unit approvals according to data released by the ABS today. 

Building Approvals — August | By the numbers 
  • Total Dwelling Approvals (all sectors) fell -9.4%m/m to 16,477 (seasonally adjusted) in stark contrast to the market forecast for a rise of +1%.  July’s decline initially reported at -5.2%m/m was upgraded to -4.6% on revision.
  • House Approvals fell -1.7% to 9,664, which follows a -2.6% decline in July.
  • Unit Approvals declined sharply by -18.4% to 6,813. Last month’s decline was -7%. 

Building Approvals — August | The details

The headline fall of 9.4% in August was particularly sharp and was the most severe monthly contraction since December last year. While the seasonally adjusted data are highly volatile month-to-month, the trend series has now declined for 9 consecutive months, after recording a further 1.9% fall in August. Through the year, building approvals have declined by 13.6% and are 9.1% lower in trend terms. The slowdown is being driven mostly by weakening unit approvals, although house approvals have also softened recently. 


For unit approvals, the sharp fall in August (-18.4%m/m) was mainly due to weakness from the high-rise segment in Sydney and Melbourne. For houses (-1.7%m/m), approvals declined in New South Wales (-3.7%), Queensland (-6.1%) and Western Australia (-0.9%). The breakdown of the state detail is shown in the table, below.   

State
August (m/m)
Annual (Y/Y)
NSW
-2.7%
-12.8%
VIC
-12.0%
-17.3%
QLD
-8.4%
-16.1%
SA
+9.6%
-4.6%
WA
+14.7%
+7.0%
TAS
-18.6%
4.9%
AUS
-9.4%
-13.6%
Based on ABS 8,731.0

The ABS also reported that the value of non-residential building approved fell 24.5% in August, while the value of alterations and additions fell 3.3%m/m.   

Building Approvals — August | Insights

Momentum in building approvals continues to ease, which matches with the broader context of declining property prices and tightening credit conditions. While population growth remains strong, particularly in New South Wales and Victoria, the pipeline of projects is being worked through after the upswing in activity over the past few years. This points to a forthcoming softening in residential construction activity, which saw a strong first half of 2018 contributing 0.3ppt to GDP growth

Tuesday, October 2, 2018

RBA on hold: growth strong but progress to remain gradual

For the 24th consecutive meeting, the Reserve Bank of Australia (RBA) maintained its official cash rate at 1.5% in October. The result was unanimously expected by markets and all 25 economists surveyed by Bloomberg Australia.


There were few changes in today's statement compared to last month. Since the last meeting, the National Accounts for the June quarter were released, which showed annual growth in the domestic economy increased by the fastest pace in nearly 6-years at 3.4%. This outcome was a little stronger than the RBA's forecast, and their expectation is that growth will continue to run above 3% in 2018 and 2019. The growth outlook is supported by non-mining business investment, public infrastructure spending, and resources exports. The household sector, facing slow income growth and high debt levels, remains the greatest source of uncertainty. 

Despite the robust growth outlook, the RBA notes that while the unemployment rate — currently at 5.3% — is trending lower, it retains that view that progress towards full-employment — estimated at around 5% — will occur gradually over the next couple of years. Similarly, while the RBA notes that wages growth has lifted a little, it continues to expect that faster increases will occur gradually in line with the strengthening in the economy. 

On inflation, the RBA has previously stated that it expects near-term inflation to decline due to once-off declines in administered prices (areas impacted by government policy). On that basis, last month's statement estimated headline inflation to fall to 1.75%Y/Y in Q3 but that figure was removed in today's release. It now simply states that inflation in 2018 is expected to be "a little lower than otherwise", which likely reflects some mitigation from recent increases in petrol prices.

In the property market, its commentary was adjusted to highlight the contrast between the owner-occupier and investor segments. While credit growth to owner-occupiers "remains robust", investor demand "has slowed noticeably". More generally, today's statement made a change noting that it is credit conditions rather than lending standards that are now "tighter than they have been for some time".

The final paragraph was unchanged reiterating the view that further progress in reducing the nation's unemployment rate and lifting inflation back towards target is likely to be gradual. Market pricing on cash rate futures currently points to the RBA remaining on hold at 1.5% for at least the next 18-months.   

Friday, September 28, 2018

ASX200 falls 1.8% in September

Australia's benchmark S&P/ASX200 index fell 1.77% in September — its weakest monthly result since March. The damage was done in the first week of the month (-2.78%) as global equity markets were unsettled by intensified concerns over trade relations and emerging market economies. 

Europe's major indices fell between 2 and 3%, and the declines in Asia were also sharp, ranging from around 1 to 3%. Meanwhile, the US tech-heavy Nasdaq index fell 2.6% with Facebook and Twitter coming under pressure after company executives fronted a Senate committee. Locally, significant news came through when three of Australia's four major banks announced independent interest rate increases to standard variable mortgage rates of between 14 and 16 basis points. 

Over the ensuing three weeks, the S&P/ASX200 saw modest rises of 0.35%, 0.47%, and 0.21%, but the turmoil from the opening week would prove to be much too significant to recover fromTo the scorecard and as the chart (ordered in index weighting), below, shows it was a tough month for most sectors (click to expand). 


Healthcare fell the most (-8.36%), driven by the Federal government's announcement of a Royal Commission into aged care providers. The Financial sector was weighed by concerns emanating from its own Royal Commission amid a period of slowing credit growth. 

It was a better month for resources after declining in August; Energy gained 4.02% and Materials lifted 2.67% supported by stronger commodities prices. 

The news was not all negative for investors in September. While the index saw its first monthly decline since March, this was in part impacted by a swathe of companies paying dividends during the month following the recent reporting season. According to data compiled by CommSec, around $A17.3 billion of dividends was paid to shareholders in September. 

On its final trading day of the month, the S&P/ASX200 index closed stronger by 26.34 points (+0.43%) at 6,207.56  — currently around its strongest levels since 2007. For the quarter, the index finished little changed, up by 0.21%, while year to date the gain stands at 2.35%. 

Wednesday, September 19, 2018

Manufacturing leads Australian employment growth

This morning the Australian Bureau of Statistics released its detailed Labour Force data for August. The bureau produces these data on a quarterly basis, which provide useful information to complement the monthly surveys. 

Of particular interest is the granular breakdown of employment growth across the 19 industries the ABS measures in the Australian economy. 

According to August's data, total employment increased by 106,600 in the 3 months to August and by 306,600 over the past year. The chart, below, shows the breakdown across the industries. 


Contributing most to new employment over the past year has been manufacturing, which accounted for 86,400 of the total increase of 306,600. Based on these data, manufacturing is the 6th largest employer in Australia, accounting for 7.7% of the workforce.

Australia's largest employer is the healthcare industry, which saw a surge in employment growth from mid-2017 into early-2018 of 154,000. Employment growth has slowed since then and increased by only 5,600 over the year to August.

Education, Australia's 4th largest employer, is another industry where employment has eased after a sharp increase over much of the past couple of years.

Construction employment totaled 30,000 over the past year, well down from the peak of 104,000 in the 12 months to August 2017. 

An encouraging aspect is a pick-up in professional services employment, which increased by 65,000 over the past year. That figure is a vast improvement from the same point last year where employment had contracted by 43,000.  

Monday, September 17, 2018

Australian property prices soften in Q2

The Australian Bureau of Statistics (ABS) released their Residential Property Prices Indexes for the June quarter (Q2) this morning, which showed prices softened by 0.7% on a weighted-average national basis in the quarter.

The summary of price changes across the capital cities are presented in the chart, below.

Prices in Sydney declined 1.2% in Q2 to be down by 3.9% through the year. In Melbourne, prices declined for a second straight quarter, easing by 0.8% but were still 2.3% higher when compared to the same point from a year earlier. 


The table, below, breaks down further the headline results for each of the nation's capital cities for Q2 and over the past year. 


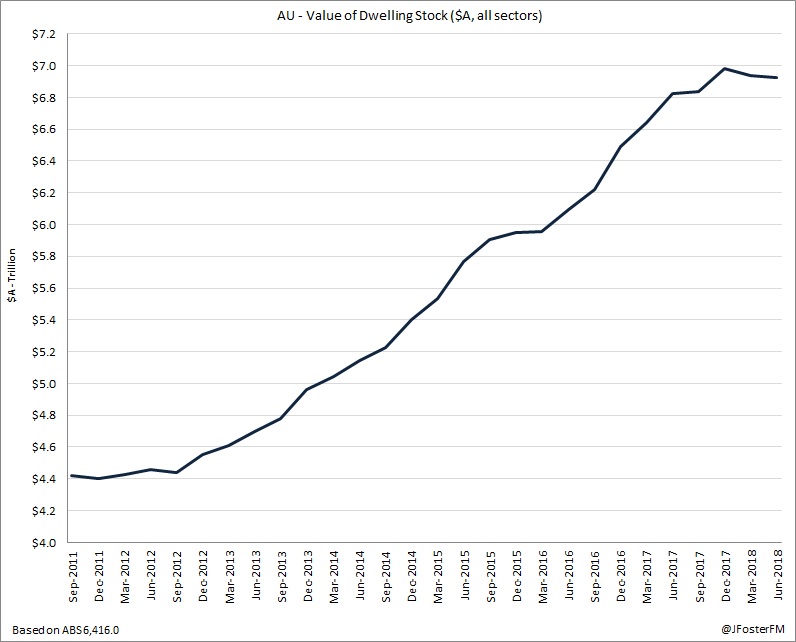
According to the ABS, the total value of residential property in Australia declined by 0.2% in Q2 to around $A6.927 trillion, with annual growth at 1.5%. 


In constructing these indexes, the ABS draws on data provided by CoreLogic RP Data, who produce more timely results through their monthly Home Value Index series. 

According to the latest CoreLogic Home Value Index for August, national property prices declined 0.3% in the month to be 2% weaker through the year.

For a comprehensive analysis of today's data, we are keenly awaiting the latest blog from Pete Wargent, a leading Australian property, economic and markets analyst. You can access his blog here; http://petewargent.blogspot.com/

Wednesday, September 12, 2018

Gradual progress in Australia's labour market

Conditions in Australia’s labour market were stronger than expected in August amid a broader context that indicates gradual progress is being made in line with Reserve Bank of Australia (RBA) forecasts.

Labour Force Survey — August | By the numbers

  • Employment increased by 44,000 in August, which was well ahead of the market forecast for +18,000. July’s initially reported decline of 3,900 was widened to 4,300.
  • Unemployment rate remained at 5.3% (market f/c was 5.3%)
  • Participation rate increased 0.1ppt to 65.7% (prior revised 65.6%)
  • Hours worked were flat in August, which eased annual growth to 2.1%


Labour Force Survey — August | The details

This survey was strong on the detail, which balances out the weakness from the previous month. Volatility of this nature is commonplace in this survey. 

Employment increased 44,000 in August but fell 4,300 in July. If those outcomes are averaged, employment increased by 19,850 per month — close to the level of around 20,000 required to keep the nation's unemployment rate steady. 

Within August's 44,000 increase; full-time work gained 33,700 and part-time lifted 10,200. Employment growth on an annual basis held at a solid 2.5%.    

At 2-decimal places, Australia's participation rate lifted 0.16ppt to 65.71. This equated to the labour force increasing by 49,780, which was mostly met by the 44,000 gain in employment. The headline unemployment rate is now 5.31% — little changed from July's 5.29%.  

An encouraging aspect of the survey was the improvements to measures of excess labour market capacity. 

The underemployment rate — workers wanting more hours as a percentage of the labour force — declined by 0.4ppt to 8.1%, while the underutilisation rate — including the underemployed and unemployed as a percentage of the labour force — declined by 0.5ppt to 13.4%.  


Both measures are now at their lowest levels in 4-5 years, although they remain elevated by historical standards having only receded gradually over the past couple of years. Further erosion in excess capacity in the labour market is key to stronger wages growth.    

Working against a stronger and quicker reduction in excess capacity has been the rapid pick-up in labour force participation over the past couple of years. This has been a function of rising employment growth and strong growth in the working-age population. 

Total hours worked are running slightly ahead of the level from a year ago (+2.1%), but after adjusting for employment growth, average hours worked per employee per month have declined marginally (-0.4%Y/Y). 


Across the states, unemployment rates declined in New South Wales (-0.2ppt to 4.7%), Victoria (-0.2ppt to 4.8%) and Tasmania (-0.5ppt to 5.8%). South Australia was steady at 5.7%. There were increases in Queensland (+0.2ppt to 6.4%) and Western Australia (+0.4ppt to 6.4%). Of concern is Queensland, where the state's unemployment rate is sharply diverging from New South Wales and Victoria. 


The breakdown of state employment growth is shown in the chart, below. 


Labour Force Survey — August | Insights

Australia's labour market appears to be making gradual progress, which is in line with the expectations of the RBA. While employment growth has moderated from the very strong pace of earlier this year, it remains solid and is tracking above growth in the working-age population. This will help to reduce excess capacity, though strong workforce participation is likely to ensure this remains a gradual proposition with little meaningful near-term impact for wages growth. 


In review: Australian Q2 GDP

Australia's National Accounts showed the domestic economy grew by +0.9% in the June quarter (Q2) lifting annual growth to its strongest level in nearly six years at +3.4%. The result was stronger than the market forecast for +0.7%q/q and +2.9%Y/Y. 

Economic growth in the March quarter (Q1) was upwardly revised by the Australian Bureau of Statistics (ABS) in this update to +1.1%q/q and +3.2%Y/Y. 

With potential growth in Australia estimated at around 2.75% to 3% in annual terms, the domestic economy has been running at an above-trend pace through the first half of 2018. This was broadly in line with Reserve Bank of Australia forecasts, which expect growth to remain above-trend over the next year. 

Headline growth has been boosted by a strong rate of population growth, estimated at around +1.6%Y/Y. Adjusting for that impact, GDP growth on a per capita basis was a more moderate +0.5% in Q2 and +1.8%Y/Y. Though subdued, the annual rate lifted to its highest level since Q2, 2012. 


*click on images to zoom  


GDP — Q2 | Expenditure: GDP (E) +0.7%q/q, +3.4%Y/Y

Household consumption (+0.7%q/q, +3.0%Y/Y) — The household sector drove growth in Q2 adding +0.4ppt to the headline figure. The lift in spending was broadly-based across the discretionary and non-discretionary areas. For context, the annual rate of +3% is around average in the post-financial crisis decade.

The key issue of persistently weak income growth remains. Growth in real household income is tracking at +1.7%Y/Y, which is unchanged year to date — meaning that households have had to direct more of their disposable income towards consumption. As a result, the household saving ratio fell to 1%, which is the lowest since Q4, 2007. Gaining increased focus recently has been the decline in national property prices. This could be the catalyst for households to rebuild savings.  


Dwelling Investment (+1.7%q/q, +3.8%Y/Y) — Residential construction drove this result overcoming weakness from renovations to add modestly to growth (+0.1ppt) in the quarter. The pipeline of work is strong, particularly in NSW and Victoria, but activity is likely to ease matching the moderation in building approvals from historic levels while financing conditions have tightened.


Business Investment (-0.2%q/q, +4.1%Y/Y) Business investment has supported activity over the past year. Non-mining investment is trending up and the drag from the unwind in mining investment from the peak reached around 4-5 years ago has almost reached the end of the line. Q2’s result was impacted by weakness in equipment spending (-1.7%) and mining sector infrastructure (-0.8%). 


Public Demand (+0.6%q/q, +4.8%Y/Y) — The public sector has greatly supported activity in recent years, which has been powered by consumption and a ramp-up in investment. Spending has been boosted by the rollout of the National Disability Insurance Scheme — a major policy initiative in the health sector — and investment, particularly in transport infrastructure, has been hastened with the nation responding to the needs emanating from strong population growth.     


Net Exports (+0.1ppt in Q2, -0.7pptY/Y) — International trade added to growth in Q2 but subtracted over the year. In Q2, export volumes increased +1.1% while imports lifted a smaller 0.4%. The export performance has been supported by the resources sectors, while imports have been lifting in line with improving business investment.  


GDP — Q2 | Incomes: GDP (I) +0.9%q/q, +3.7%Y/Y

Nominal GDP growth was +1.0% in Q2 — a more modest outcome than recorded in Q1 at +2.4%. Annual growth lifted from +4% to +5.5%, though this reflected a base effect as the decline of -0.4% from Q2 last year fell out of the calculation. The recent peak came in Q1, 2017 where annual growth was +7.7%, which then fell back to +3.6% in Q4.   

Australia’s Terms of Trade fell -1.3% in the quarter, with commodity prices easing after a stronger outcome in Q1 that drove an increase of +3.5%. However, the Terms of Trade are still ahead over the past year (+2.1%), which has provided a lift to national income.


The distribution of that income has, however, been unbalanced. Total corporate gross profits increased +1.0% in Q2 to +8.8%Y/Y. Within this, profit growth for private non-financial companies is running at +9.7%Y/Y and +6.2%Y/Y for financial companies. Total corporate profit growth is still strong even after moderating from an average pace of +17.5%Y/Y between Q4, 2016 and Q3, 2017. 

Wages and salaries paid to employees lifted by +0.7% in Q2, while annual growth eased slightly to +4.8%. This, however, remains around the level from the previous three quarters and well above the low of +1.4%  that prevailed between Q4, 2016 and Q1, 2017. Over the past few years, low rates of wages growth have been persistent and this has restricted growth in employee’s income. Hours worked increased +1.1% in Q2 to +2.3%Y/Y.


GDP — Q2 | Production: GDP (P) +1.0%q/q, +3.1%Y/Y

Output growth rates across the industries for the quarter and year are broken down in the chart, below. 

The strength in healthcare related services is notable and fits with the needs of a growing population. The sector is also the nation’s largest employer and employment growth has been strong over the past couple of years. 


Drought conditions impacting the eastern states is an emergent risk, which could have flow-on implications for agricultural exports.    


GDP — Q2 | Prices

Price levels remain subdued in line with the more narrowly-focused ABS inflation data. The GDP implicit price deflator   the broadest measure of inflation across the economy  lifted +0.2% in Q2 to +2.0%Y/Y. Though the lift in annual growth was sharp; from +0.8% to +2.0%, that was base effect impacted.  

The GDP implicit price deflator typically tracks changes in the Terms of Trade. With the Terms of Trade moderating over the past few quarters after a spike in 2016-2017, economy-wide inflation has pulled back.

The household consumption deflator — the closest proxy to the ABS’ Consumer Price Index (CPI)  reflects dynamic changes in purchasing patterns over time as consumers switch towards cheaper goods and services. This measure was soft in Q2 at +0.2% easing annual growth from +1.6% to +1.5%. The CPI in Q2 was +0.4% and +2.1%Y/Y. This points to downside risks to the CPI measurement in the quarters ahead.


GDP — Q2 | Productivity

Productivity growth in Australia has been weak in recent years matching with the experiences of several other major advanced global economies. This shows little sign of improving. 

While total hours worked across the economy increased by +1.1% in Q2 (+2.3%Y/Y), this was faster than output growth at +0.9%. As a result, GDP per hour worked fell in Q2 by -0.2%, though annual growth held at a subdued +1%. 

In the market sector, real GDP per hour worked also declined by -0.2% in Q2, with annual growth easing to just +0.4%.  


Analysing the inflationary pulse, the forward-looking indicators point to a soft outlook. Non-farm nominal unit labour costs — reflecting the cost of labour per unit of output — declined a further -0.4% in Q2 to drag the annual growth rate down to +0.4%, continuing their decline since the recent peak of +2.2%Y/Y in Q4, 2017. 

In real-terms, non-farm unit labour costs fell -0.5% in Q2, which saw the annual rate go in reverse to -1.6%. This followed a contraction in Q1 of -2.0%, while annual growth was +0.8%. Annual growth has also been in decline since the peak from Q4 last year. 


GDP — Q2 | States

Victoria remains the strongest performing state economy in the nation. Strong population growth is boosting residential construction and driving an upswing in public demand led by infrastructure investment. This has facilitated a positive spillover impact for private sector business investment. Reflecting retail sales data, household consumption is a strong +3.8%Y/Y and is running ahead of the other states.

In New South Wales, demand was soft in Q2 with declines in public demand and business investment. There are varying outlooks here; investment in public infrastructure will continue, however details around business investment are patchy. Activity in residential construction will be required to accommodate population growth. Household consumption is supported by strong employment growth, though income growth is subdued.     

Demand conditions in Queensland, South Australia and Tasmania were at or around the pace of national domestic demand growth (+3.4%Y/Y). 

Conditions in Western Australia are no longer in decline, but unwinding mining sector investment remains a drag as does residential construction. Public demand is providing some offset.