Pages

Tuesday, August 31, 2021

Australian Q2 GDP 0.7%; 9.6%Y/Y

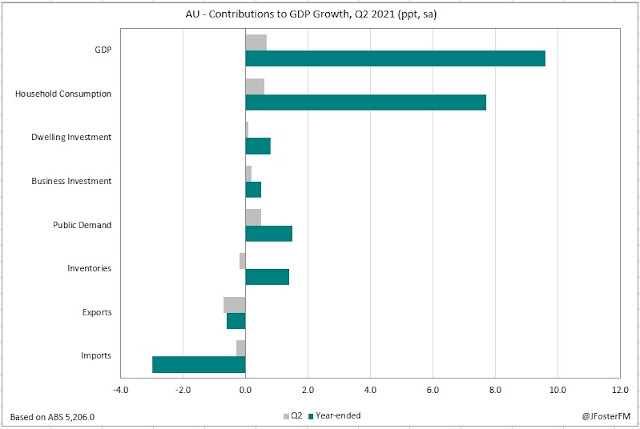
Australia's economy expanded at a faster than expected pace in the June quarter rising by 0.7% against the market median of 0.4%. Growth in annual terms surged from 1.3% to 9.6% as last year's historic contraction of -7% during the depths of the national lockdown fell out of the calculation. 


Ahead of the setback to come from the emergence of the Delta variant and associated lockdowns, momentum in the Australian economy was strong with output in the June quarter rising to be 1.6% above its pre-pandemic level. However, the international border restrictions and its impact on population growth meant GDP was still tracking below its forecast trajectory from February 2020, based on RBA forecasts. 


Household consumption remained robust in the quarter (1.1%), contributing 0.6ppt to growth. The ongoing rotation in spending patterns broadened, with services up 1.3% to growth of 0.9% in goods. Meanwhile, discretionary spending advanced by 1.6% as essentials lifted by 0.9%. Household consumption was almost back to end 2019 levels, while the profile of spending was returning to its pre-pandemic shares, though Delta has disrupted that. The rise in spending was funded by a draw down in the saving ratio in Q2, from 11.6% to 9.7%, as real disposable income was lower over the period (-1.0%).   
 

Private investment continued to advance, with residential construction (1.7%q/q) coming in better than partial indicators had suggested and business investment expanding further (2.3%q/q), with equipment spending a key contributor in response to tax incentives. 

Public demand saw another robust showing, lifting 1.9%q/q with state and territory governments bringing forward projects to provide stimulus to local recoveries. 

Inventories were a key surprise, subtracting only 0.2ppt from growth in Q2 against an expected -0.7ppt. Builds on public (0.35ppt) and farm inventories (0.15ppt) moderated the overall drag on growth.    

Net exports were in line with expectations, taking away 1.0ppt from quarterly activity. Exports contracted by 3.2%, weighed by disruptions in the resources sector (-5.9%). Imports continued to lift (1.5%) on robust domestic demand.  


Other key highlights from the quarter included a surge in national income, with nominal GDP lifting another 3.2% to be nearly 8% higher than prior to COVID. Elevated commodity prices drove the terms of trade to a record high level, generating strong tailwinds for company profits and government revenues. 


Meanwhile, hours worked continued to rebound on eased restrictions and vibrant trading conditions, rising by 1.9%q/q across the economy and by 2.3%q/q in the market sector. Hours worked were approaching pre-pandemic levels but have been disrupted significantly in Q3.


Link to full review here  


Australian dwelling approvals retrace further in July

Australian dwelling approvals were 8.6% lower in July, continuing their unwind from the recent peaks associated with the HomeBuilder stimulus. Approvals remain at elevated levels but could be hit by the current lockdown cycle, particularly as the restrictions have impacted activity on construction sites.   
  
Building Approvals — July | By the numbers
  • Dwelling approvals (seasonally adjusted) fell by more than expected in July, declining by 8.6% for the month to 17,601 against -5.0% forecast (prior: -5.5%m/m). Annual growth in approvals slowed to 21.5% from 51.6%; the base period coinciding with the start of the HomeBuilder grants scheme. 
  • House approvals contracted by -5.7% to 11,752 (27.3%yr)
  • Unit approvals declined by -14% in the month to 5,850 (11.3%yr)


Building Approvals — July | The details 

National dwelling approvals continued to unwind following the closure of the HomeBuilder scheme to new applicants at the end of March. As of July, dwelling approvals were 24.9% lower than their peak in March. The 8.6% fall in July extends the retracement to a 4th consecutive month following the declines of -5% in April, -8.4% in May and -5.5% in June. 

From their low point last year, private sector detached house approvals soared by 85% to reach a record high in April. Approvals were brought forward on the support of HomeBuilder, while low interest rates and rising house prices were also key factors. The segment is now driving the unwind, with approvals around 24% down on their peak. Private sector unit approvals have also slid over recent months to be around their level at the end of last year. 


House approvals across the states further highlight the retracement underway, though even allowing for the completion of HomeBuilder, approvals remained at high levels. To highlight the point, compared to pre-HomeBuilder 2020 lows, approvals in July were 76% higher in Western Australia, 59% in Queensland, 35% in South Australia and 30% in New South Wales and Victoria. 


Approvals for alterations were also boosted by the HomeBuilder grants as they were available for substantial house renovations. Since a record high value of alteration work ($1.13bn) was approved in April there has been a retracement, pointing to the wind-down of the scheme. However, at just under $1bn for July alteration approvals remain very elevated. Strong growth in house prices may be encouraging owner-occupiers to make improvements, as could more time at home due to lockdowns. Tightening rental markets and a strong pick-up in investor activity over recent months may also be another source of strength in the renovations segment. 


Building Approvals — July | Insights 

Similar to recent reports, building approvals continue to come down from the peaks earlier in the year following the end of the HomeBuilder scheme. The scheme, and other stimulus measures, have ensured there is a now substantial pipeline of residential work. Surprisingly, the recent construction activity data suggested residential construction flatlined in Q2, possibly with some supply constraints in the mix. Lockdowns will lead to further volatility in approvals and construction activity in Q3, but beyond these disruptions the outlook is strong. 

Australian Current Account +$20.5bn in Q2; net exports -1.0ppt

Australia's current account surplus has continued to surge reaching a new record high in the June quarter. Elevated commodity prices are driving national income higher, though net exports will subtract heavily from GDP in Q2 due to disruptions affecting resource shipments to offshore markets. 

Balance of Payments  — Q2 | By the numbers
  • Australia's current account was in surplus by $20.5bn in Q2, lifting from $18.9bn in the previous quarter (revised from $18.3bn) but lower than the market forecast for $21.4bn.
  • The trade surplus widened by $3.7bn over the quarter to a record high at $28.9bn.  
  • The income deficit expanded by $1.1bn to $7.4bn.  
  • ABS reported that net exports will take away 1.0ppt from quarterly GDP in Q2. 


Balance of Payments — Q2 | The details 

Australia extended its run of quarterly current account surpluses out to 9 in the June quarter. The latest showing was the nation's largest on record, going through $20bn to be equivalent to a sizeable 3.9% of GDP. 


Driving the rise in the current account surplus was a widening in the trade balance, from $25.4bn to $28.9bn. This reflected surging commodity prices, with export earnings seeing another strong uplift rising by 5.9% in the quarter (18.4%Y/Y). Import spending increased 3.7% (14.4%Y/Y) on robust domestic demand. The wider trade balance was moderated by an increase in the income deficit for the quarter, from $6.2bn to $7.4bn, on higher returns to foreign investors.  

Trade volumes pointed to a sizeable negative contribution from net exports to quarterly GDP of -1.0ppt. Exports contracted by 3.2% in the quarter to be 2.6% lower through the year and remained substantially (-13.9%) below pre-pandemic levels. That predominantly reflects weakness in services exports (-45.6% vs pre-pandemic) due to the closure of the international border, though goods exports are also lower over the period (-5.0%). 


In Q2, the weakness was in non-rural goods (-2.8%) and non-monetary gold (-25.7%q/q). Across these two categories, resource exports were substantially weaker in the quarter (-5.9%) and through the year (-6.4%), to be at their lowest level in 3½ years. Adverse weather and maintenance activity were key factors in this weakness. 


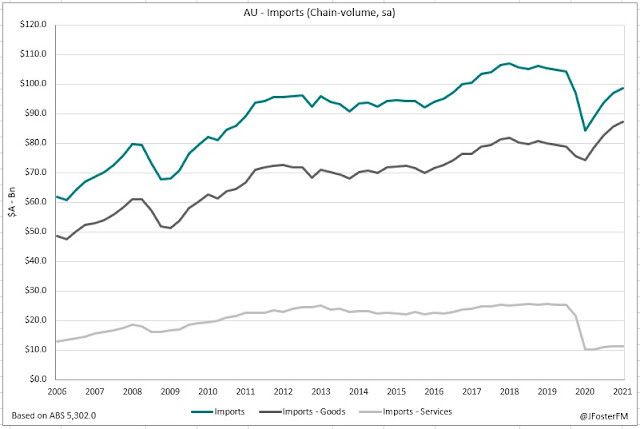
Imports lifted for a 4th consecutive quarter rising by 1.5% in Q2 (16.8%Y/Y). A strong economic recovery in Australia has drawn in imports, though they are still 5.4% down on pre-pandemic levels. Beneath the surface, we see one of the main themes to emerge from COVID  — that being the rotation in spending away from services to goods. Services imports (-55.2% vs pre-pandemic) have been crunched by the overseas travel ban, but goods imports have surged to be up by 10.5% since the end of 2019. 


Intermediate goods led in Q2 with a 3.1% lift, while capital goods increased to a 2.2% gain from 0.9% in the previous quarter. Consumption goods were broadly flat in the quarter (-0.1%). All goods-related categories are elevated compared to pre-pandemic levels, reflective of the robust recovery in domestic demand seen in Australia.  

  
Balance of Payments — Q2 | Insights 

Contrasting details ahead of tomorrow's Q2 GDP data. While net exports are a significant weight on activity in the quarter, mainly due to disruptions in the resources sector, nominal outcomes were strong. The terms of trade look to be up by 7% in the quarter, boosting company profits, wages and government revenues. 

Sunday, August 29, 2021

Australian Business Indicators Q2: Inventories 0.2%

Australia's Business Indicators data for the June quarter reported that the rebuild in inventories from last year's recession stalled unexpectedly, but company profits and wages continued to advanced on strength in commodity prices and a widening reopening. The return to lockdowns has since shifted things significantly. 
  
Business Indicators — Q2 | By the numbers 
  • Inventories were broadly flat in Q2, rising by 0.2% to $168.5bn; a sizeable miss on the 1.2% rise expected. Annual growth lifted from -0.7% to 2.4% on base effects. 
  • Company gross operating profits advanced by 7.1% to $118.3bn (vs a 2.5% increase expected), though annual growth slowed to 5.5% from 11.7%.  
  • Wages and salaries posted a rise of 2.0% in the quarter to $153.7bn as growth through the year surged from 2.7% to 8.1%, with the base period going back to the depths of last year's lockdowns. 


Business Indicators — Q2 | The details

The rebuild in inventories by Australian businesses from the COVID recession stalled in the June quarter, rising by just 0.2% against a 1.2% increase expected. This followed the 2.4% lift posted in Q1 that added 0.7ppt to quarterly GDP, pointing to a reversal in the June quarter. Notably, retail (0.6%) and wholesale (-0.7%) inventories posted soft outcomes after surging higher in Q1; +7% for the former and +4% for the latter. Manufacturing (-0.1%) saw a third consecutive quarterly fall. Firms in accommodation and food services (10.5%) continued to add back capacity to meet demand with restrictions easing, but this was all prior to the Delta outbreaks. Overall, inventories remain around 2% below pre-pandemic levels and are now subject to considerable lockdown and reopening swings. This could turn out to put upward pressure on prices when the reopening comes if supply/demand imbalances are significant enough. 

Gross company profits lifted by 7.1% for the quarter to $118.3bn to be up 5.5% through the year. Adjusting for inventory valuation effects, company profits were 6% higher in Q2 ($113.1bn). The key dynamic was the surge in mining profits (18.4%qtr, 43.4%yr) on the back of elevated commodity prices. Non-mining profits declined for a third consecutive quarter (-1.1%) and were sharply down through the year (-14.3%). The onset of the pandemic saw significant cash flow support being channeled from government to businesses, such that company profits surged over the first half of last year, coinciding with the COVID recession. With that support being withdrawn and the reopening boost fading, profits in the non-mining sector were moderating back to their pre-pandemic trajectory. 


Sales across the industries are shown in the chart below. The annual rates are boosted by base effects and are most pronounced in COVID-exposed areas (accommodation and food, arts and recreation, transport (includes travel) and other services). In Q2, sales moderated in retail (0.8%) but were well above pre-pandemic levels. The rebound in services areas continued in Q2, with accommodation and food 2.4% and arts and recreation 0.3%, but both were still well below pre-pandemic levels. The exception was other services, up 2.5% in Q2 and 2.1% above its end 2019 level.   


The rebounding labour market and strong employment outcomes supported a 2.0% rise in the wages bill in Q2 to be 8.1% above last year's depths. Wages paid recovered to be well above pre-pandemic levels in most industries but were still lagging in those most impacted by COVID; arts and recreation (-4.5%), transport (-1%) and accommodation and food (-0.9%). The strongest industries relative to pre-COVID are finance and insurance (13%), healthcare (11.7%) and real estate (11.4%). 


Business Indicators — Q2 | Insights

Mixed outcomes from today's report given the weakness from inventories but strength from incomes in company profits and wages. Further disruptions from the pandemic will come through in Q3, so these figures remain subject to considerable volatility.

Friday, August 27, 2021

Macro (Re)view (27/8) | Progress towards Fed tapering

Markets waited all week for the speech by Federal Reserve Chair Jerome Powell at the Jackson Hole symposium. Overall, Chair Powell franked the views that many of his colleagues have expressed of late that tapering of its asset purchases from their current $120bn/month rate is nearing, though his assessment of the timing was less committal in light of the Delta variant, simply saying that it could be appropriate some time "this year". Importantly, he went on to emphasise that tapering would be disconnected from the eventual lift-off for interest rates, the latter having a "different and substantially more stringent test" attached to it. The key factor for the timing of taper depends on labour market; still seen as being very much in recovery mode. The FOMC will be weighing up the strength in job gains — averaging around 830k per month over the past 3 months  against the headwinds associated with Delta and spare capacity that is considerable beyond reported measures. On the inflation side of the mandate, the Fed's preferred indicator remains well above its 2% target holding at a 3.6% annual pace in July. Chair Powell reiterated on Friday that this continues to reflect the reopening boost and is not something monetary policy should be reacting to. The huge disparity between durable goods inflation and services inflation — something highlighted on these pages over recent months  is the predominant factor behind the Fed's think that high inflation will be transitory. Historically, services have been the driver of inflation, with durable goods inflation negative over the past 25 years, on average. That flipped dramatically due to the pandemic — goods consumption surged as services spending plunged — but is now gradually unwinding as the economy opens up. The rotation in spending from goods to services made further progress in July; the former falling 1.1%m/m compared to a 1.0% rise for the latter, but as the chart below highlights, both remain a long way from returning to their pre-pandemic shares of total consumption.   

Chart of the week

In Europe, momentum generated by the reopening in Q2 looks to be extending into the current quarter. August's preliminary PMI softened slightly from 60.2 to 59.5 but remained at a highly expansionary level, placing GDP on track for growth of around 2% in Q3. A key development was that the pace of activity in the services sector (59.7) surpassed that for manufacturing (59.2) for the first time over the course of the pandemic. Eased restrictions are driving the former, while for the latter the pace is moderating amid supply chain constraints as new order inflows remain at very high levels, leading to continued pressure on input prices. The account of the ECB's policy meeting late last month noted that, aside from uncertainty around the impact of the Delta, the recovery was seen to be back on track and the pick-up in inflation reflected transitory factors. Unlike at the Fed, the account contained no clear signs of the Governing Council discussing tapering purchases in its PEPP program from their current accelerated pace. An interview with the ECB's Chief Economist Philip Lane suggested that if there were "spillovers" to financing conditions in Europe from Fed tapering, it would be prepared to respond. Contrary to the interpretation of markets, the account noted that the reformulated forward guidance implemented by the ECB following the tweak to its inflation mandate "did not necessarily imply lower for longer interest rates" as, if seen as credible, would result in inflation expectations being anchored at its 2% target.   

— — 

In Australia this week, virus cases increased to their highest daily levels of the pandemic, but importantly vaccinations are accelerating sharply, with the double-dose rate sitting at around 33% of the population aged 16 and above, while first doses are at 56%. The tight and extended lockdowns occurring in New South Wales, Victoria and in the ACT are taking a heavy toll on the economy. Labour market conditions have rolled over on these disruptions, with payroll jobs tracked in the ABS's high-frequency series falling by 2% nationally over the second half of July to be down 3.7% since the start of the month. Retail spending fell at its sharpest rate this year with a 2.7% decline in July (-3.1%yr), weighed heavily by the shuttering of non-essential retail in NSW (-8.9%m/m). Meanwhile, the Australian preliminary PMI for August deteriorated to its weakest reading (43.5) since the early stages of the pandemic, indicating that the hit coming to GDP in Q3 is shaping up to be in the order of -3%. But in the meantime, the June quarter national accounts are on the tape for release next week, with the median estimate sitting at 0.5% for Q2 GDP (preview here). Feeding into that report are the inputs that came to hand during the week for construction activity and business investment.  

In a weaker-than-expected outcome, construction activity lifted by 0.8% in Q2 against the median forecast for a 2.8% rise (reviewed here). The surprise was the deceleration in private sector residential construction (-0.2%q/q) from the surge in growth in the past couple of quarters, as activity was brought forward by stimulus measures including the HomeBuilder grants scheme and first home buyer incentives. Perhaps capacity constraints were becoming a factor, that is if the rise in materials and labour costs seen in other recent data points are reliable signs of this. More material declines in residential activity are in prospect in Q3 due to the restrictions on the construction sector in the Sydney and Melbourne lockdowns, though there remains a large volume of work in the pipeline beyond these disruptions. Meanwhile, weakness persists in private non-residential construction following the hit to investment plans at the onset of the pandemic; activity in the segment falling a further 0.4%q/q to be down 12% through the year. Offsetting support came from the public sector (3.2%q/q) with state and territory governments bringing forward projects to provide stimulus to their local recovery efforts. 

Private sector business capex saw its strong momentum maintained in June quarter rising by 4.4%; annual growth accelerated — partly reflecting base effects — to 11.5% (reviewed here). The tax incentives from last year's federal budget (then expanded in Budget 2021/22) and the strength in domestic demand conditions have driven equipment spending to an 8-year high to be 10% above pre-pandemic levels. Capex in buildings and structures lifted by 4.6% for the quarter, though the more relevant guide for the contribution to GDP from non-residential work comes from the construction activity data. Firms' forward-looking investment plans for 2021/22 were upgraded strongly by 12.5% from 3 months to $127.7bn, raising questions around the durability of that optimism given the sharp deterioration in the economy associated with Delta.  

Preview: Australian Q2 GDP

Australia's National Accounts for the June quarter are due to be published by the ABS today (11:30am AEST). Economic growth is expected to have slowed in Q2, with the median estimate at 0.4%, though the annual pace will surge as the historic 7% contraction from the depths of the pandemic falls out of the calculation. The economic recovery from the COVID recession extended into 2021 as real GDP expanded by 1.8% in the March quarter following a 6.8% rebound over the second half of last year. 


In Q1, output had rebounded to be 0.8% above its pre-pandemic level and this transition from the recovery to the expansion phase continued in the June quarter. However, headwinds from the Delta variant would emerge towards the end of the period, disrupting this trajectory significantly. A two-week lockdown occurred in Victoria between late May and early June, while the lockdown in greater Sydney commenced in late June. Back in April, there was a snap 3-day lockdown in Perth. Momentum in high-frequency indicators tracking household activity and mobility started to weaken towards the end of the quarter, reflecting the lockdown in Victoria and the emerging concerns associated with Delta in New South Wales. Vaccinations were gradually rising over the quarter following the commencement of the program in late February.


Household spending patterns were continuing to rebalance over Q2, with dining out and sales of clothing and footwear and recreational goods benefitting from eased restrictions. Areas supported by lockdowns, such as household goods and food, were moderating from elevated levels earlier in the pandemic. The dynamics for household spending remained highly supportive with sentiment strong, interest rates very low, high accumulated savings and robust labour market conditions as the unemployment rate fell to its lowest level in a decade. 


Conditions in the major housing markets remained robust with housing prices increasing at an accelerated pace in the capital cities and in regional areas. The upswing in residential construction activity stalled during Q2, potentially reflecting supply constraints due to the surge in demand brought forward from the HomeBuilder scheme and first home buyer incentives. Business investment maintained strong momentum as it continued to rebound from the COVID recession. Strong domestic demand conditions were encouraging firms to invest, supported by tax incentives, accommodative financing conditions and high sentiment. Reflecting these dynamics, import volumes continued to advance, though resources exports were disrupted by adverse weather during Q2; in turn, net exports subtracted from overall activity in Q2. National income continued to be boosted by surging prices for iron ore and other commodities as well as for many rural exports. 

As it stands | National Accounts — GDP

A key milestone in the recovery was reached in the March quarter as Australian GDP lifted to be 0.8% above its pre-pandemic level. Output growth expanded for a third consecutive quarter since the national reopening with GDP rising by 1.8% in Q1 as growth through the year turned from -1.0% to 1.1%. Household consumption rebounded strongly over the second half of last year to drive the recovery as more opportunities to spend became available. However, in Q1 the main driver of growth was private investment, reflecting stimulus measures to support residential construction and business investment. 


Offshore, a resurgent virus was weighing on economic recoveries. Growth across OECD economies slowed further in Q1 to 0.6% from 1.1% in Q4 — this coming after Q3's reopening surge of 9.4%. Output in the UK (-1.6%) and euro area contracted (-0.3%) in the March quarter, weighed by lockdowns and tighter restrictions. Growth in the US economy remained resilient to the pandemic  the pace lifting to 1.5% from 1.1% in Q3 — supported by large-scale fiscal and monetary stimulus. Output in China moderated to growth of 0.4% in the March quarter but GDP was now 7.1% higher than pre-pandemic levels. 


Turning back to Australia, growth in household consumption moderated to 1.2% in Q1, remaining 1.5% below its pre-pandemic level. Spending patterns were continuing to adjust to the reopening with services rebounding further (2.4%q/q) as goods spending declined (0.5%q/q), though the latter remained elevated compared to pre-pandemic levels. Accumulated savings were continuing to support household spending. Consumption growth was stronger than the rise in real disposable income in the quarter (0.5%), prompting a reduction in the saving ratio from 12.2% to 11.6%.   


Private investment increased strongly rising by 5% for the quarter, driving it to around 3% above pre-pandemic levels. The residential construction cycle was in the midst of a strong upswing — activity in Q1 lifted at its fastest pace in 17 years rising by 6.6% — with alterations (10.8%q/q) and new home building (3.5%q/q) surging in response to the HomeBuilder scheme, low interest rates and rising housing prices. Business investment continued to rebound lifting by 3.6% in the quarter after a 2.3% lift in Q4 but was still below the weak levels that prevailed prior to the pandemic. The impulse was coming from equipment spending (10.3%q/q) with businesses capitalising on tax incentives as they responded to strong demand with the economy rebounding. Reflecting this, imports (3.7%q/q) were continuing to expand at a faster pace than exports (0.5%q/q), leading to net exports weighing on overall activity in Q1 (-0.6ppt). 


Key dynamics in Q2 | National Accounts — GDP 

Household consumption — Solid momentum was maintained in household consumption in Q2, with high-frequency card data indicating that this was continuing to be led by services spending. Retail sales volumes advanced by 0.8% in Q2 with the strongest categories being dining out at cafes and restaurants (3.9%) and clothing and footwear (3.0%), pointing to the effects of eased restrictions and the boost to discretionary demand from fiscal and monetary stimulus and strong household balance sheets. 

Dwelling investment — The upswing in the residential construction cycle stalled in the quarter as both new home building (-0.1%) and alteration work (-0.6%) declined. Supply constraints may have been a factor given the surge in demand over recent quarters driven by stimulus from the HomeBuilder scheme, first home buyer incentives and low interest rates. 

Business investment — Strong momentum in capex spending continued in Q2, rising by 4.4% in the period. Equipment spending (4.3%q/q) advanced further, surging 10% above pre-COVID levels. The rebounding economy, upbeat sentiment, accommodative financing conditions and tax incentives remained the drivers for business investment.   

Public demand — Robust growth in public demand continued in Q2, supported by rising consumption spending (1.3%) and underlying investment (4.4%). Public demand is expected to add 0.7ppt to quarterly GDP. 

Inventories — Strength in the recovery and the rebound in domestic demand conditions led to a rebuild in inventories in Q1 from their very low levels during the COVID recession last year. However, the rebuild stalled in Q2. 

Net exports — Following a -0.6ppt contribution in Q1, net exports subtracted 1.0ppt from activity in the June quarter. Demand for imports remains strong in line with the recovery in the domestic economy, while resource exports were impacted in Q2 by adverse weather conditions and maintenance work. 

Wednesday, August 25, 2021

Australian Capex 4.4% in Q2; 2021/22 investment plans $127.7bn

Australian private sector capital expenditure expanded by a further 4.4% in the June quarter, rebounding to be 3% above pre-pandemic levels. The strong recovery in the domestic economy and tax incentives have turned the cycle in business investment from extended weakness prior to COVID and investment plans continue to be upgraded on the back of this. However, it remains to be seen the effect the emergence of the Delta variant will have on this momentum. 

CapEx — Q2 | By the numbers
  • Private sector capex was stronger than expected in Q2 rising by 4.4% against an estimated 2.5%, coming in at $32.7bn (11.5%Y/Y). This followed the 6.0% increase in Q1. 
  • Equipment, plant and machinery capex posted a 4.3% rise in the quarter to $15.8bn to be up by 17.3% through the year.
  • Buildings and structures capex lifted by 4.6% — its fastest quarterly rise in more than 9 years — to $16.9bn (6.5%Y/Y).  
  • Forward-looking investment plans on firms' 3rd estimates for 2021/22 were upgraded by 12.5% on estimate 2 to $127.7bn and were 17.5% higher than year-ago levels.  


CapEx — Q2 | The details

Strong momentum in business capex spending was maintained in the June quarter, rising by 4.4% following on from the rebounds in the previous two quarters of 3.0% (Q4) and 6.0% (Q1). Enhanced by base effects, annual growth in capex accelerated to 11.5% — a pace last seen during the unwind from the mining investment boom. At $32.7bn, quarterly capex was around 3% higher than the weak levels that prevailed prior to the onset of COVID. 


Growth in capex in Q2 was driven almost exclusively by the non-mining sector (6.0%q/q) as mining investment remained subdued (0.4%q/q). Capex from the non-mining sector was $23.9bn in the quarter to be 2.6% higher than its pre-pandemic level at Q4 2019. The rebound continues to be driven by equipment spending (5.3%q/q) in response to the tax incentives available to businesses included the past couple of federal budgets, including instant asset write-offs and loss carry-back provisions. The strength and speed of Australia's economic rebound has encouraged businesses to invest to help meet rising demand. Buildings and structures capex in the non-mining sector saw its fastest quarterly rise (6.9%) in 6 years but was 5% below pre-pandemic levels.     


Turning to the mining sector, capex posted a broadly flat outcome in Q2 (0.4%) at $8.8bn. Surging commodity prices have not had any noticeable effect on capex in the sector over the past year (2.2%). Buildings and structures capex was modestly higher in Q2 (0.8%) as equipment spending softened (-0.5%). 


For the June report, Australian firms submitted their 3rd estimates of investment plans for 2021/22. These estimates were put through to the ABS during July and August as the concerns associated with the Delta variant were emerging, so some caution is warranted in assessing these outcomes. Plans for 2021/22 were nominated at $127.7bn, representing a 12.5% increase on the figure from 3 months ago and up 17.5% from last year when the economy was starting its recovery from the first wave of COVID. My forecast for the 3rd estimate was $120bn (+6% on est 2), expecting that plans may be being revised due to Delta. Today's outcome points to strength rather than resilience but whether that level of optimism holds up over the second half of the year remains to be seen. Business surveys have weakened considerably of late as economic conditions have deteriorated and uncertainty has ramped up — strong headwinds for the capex outlook. 

Investment plans in the non-mining sector were elevated by 15.4% from estimate 2 to $87.9bn to be up almost 25% year to year. The underlying detail pointed to plans for equipment spending being on track for a year-to-year rise of 33.9% ($41.9bn) and buildings and structures gaining more momentum as the period progresses to lift 17.5% ($46bn). Plans in the mining sector were pointing to a 4.0% rise through 2021/22 ($39.8bn), indicating no material uplift despite high commodity prices, with modest rises in equipment (6.6%) and buildings and structures (3.0%).    


CapEx — Q2 | Insights

An upbeat result for capex in Q2 as strong momentum continued in equipment spending with the domestic economy rebounding and supported by tax incentives to encourage business investment. Buildings and structures capex firmed but remains at low levels. Forward-looking capex plans were revised strongly higher for 2021/22. How durable the upturn in capex spending and investment plans will be to the setback in the economy associated with the Delta variant remains the key issue.

Preview: CapEx Q2

Australian private sector capital expenditure data for the June quarter is due for release this morning (11:30am AEST). The effects of the COVID recession intensified pre-existing weakness in capex prior to the pandemic, with firms putting off investment decisions amid heightened uncertainty and to preserve capital. A strong economic recovery and tax incentives had turned the cycle by early 2021, though the momentum now confronts significant headwinds associated with the outbreak of the Delta variant.  

As it stands Capital Expenditure

Growth in capex elevated to a 6.3% rise in the March quarter following on from a 4.2% increase in the final quarter of 2020. This brought capex to $31.5bn to be around 1% below pre-pandemic levels, which compared to a trough of -7% reached in the September quarter. Annual growth in capex turned positive on the result, from -7% to 0.8%.


Equipment spending was overwhelmingly driving this rise in capex on the back of tax incentives introduced in the 2020/21 Federal Budget, including instant asset write-off and loss carry-back provisions. After rebounding by 7.3% in Q4, equipment spending advanced by 9.1% in Q1 to be around 6% higher than pre-pandemic levels. Spending on buildings and structures was moving off its lows from the pandemic rising by 3.8% in the quarter but remained down over the year (-3.4%).


The non-mining sector was driving the upturn in capex with a 7.1%q/q rise extending the 6.2% lift in Q4. Goods-related industries (including manufacturing, construction and wholesalers) have been prominent rising 18.3% over the period while household (9.5%) and business services (8.5%) have also seen rebounds. Mining capex remained at subdued levels but lifted by 4.1% in Q1, driven mainly by equipment spending (8.1%q/q).   

Businesses put through their 2nd estimates for capex spending in 2021/22 in the previous survey, nominating a figure of $113.6bn. This was a 7.9% upgrade on the 1st estimate ($105.3bn) and was running around 15% higher than investment plans from a year ago when projects were being shelved following the onset of the pandemic. 


Market expectations Capital Expenditure

For the June quarter, markets look for an overall rise in capex of 2.5% between estimates sitting at 0.8% to the low side and 4.5% on the high end. Today's survey will also include firms' 3rd estimate for investment plans in 2021/22. These estimates were submitted by firms to the ABS between July and August, coinciding with the emergence of the Delta variant. This could lead to a more cautious outlook given the uncertainty of the situation. Last year, estimate 3 was upgraded by 10% on estimate 2, whereas the average upgrade from the previous 5 years was around 15%. Assessments might be a little more cautious for 2021/22 given that uncertainty remains over the timeline to a sustained reopening whereas last year the worst of the pandemic looked to be in the past. My estimate is for an upgrade of 6%, taking estimate 3 to around the $120bn level. 

What to watch Capital Expenditure

Today's report is likely to be one to watch with some caution given the resurgence of the pandemic. Capex is expected to have shown further strength in Q2, but it remains to be seen how durable the momentum will be not only to the setback that the economy is now confronted with but also to a reopening that is uncertain in terms of its timing and restrictions that might persist. Investment plans over the near term could be weighed until some of this uncertainty is resolved.

Tuesday, August 24, 2021

Australian construction activity 0.8% in Q2

Australian construction activity came in at the bottom end of the range of market estimates rising by 0.8% for the June quarter. The surprise was that the upturn in the residential construction cycle cooled in Q2 as both new home building and alterations declined. Headwinds related to the pandemic continued to weigh on non-residential construction. This weakness was offset by rising activity by the public sector with state and territory governments bringing projects forward to provide stimulus to the recovery. 

Construction Work Done — Q2 | By the numbers
  • Construction work done (across the private and public sectors) was 0.8% higher in the June quarter at $52.9bn against the median estimate for a 2.8% rise. Activity in Q1 lifted by 2.4%. Growth through the year firmed from -0.3% to 0.4%.
    • Engineering work +1.8%q/q to $22.3bn (-2.7%Y/Y)
    • Building work +0.1%q/q to $30.6bn (+2.8%Y/Y), which includes;
    • Residential work -0.1% to $19.0bn (+8.9%Y/Y)
    • Non-residential work +0.3%q/q to $11.5bn (-6.0%Y/Y) 


Construction Work Done — Q2 | The details 

In a much weaker-than-expected outturn, construction activity across the economy was 0.8% higher for the June quarter, coming in at the bottom of the range of market forecasts for today's report. Construction work had lifted sharply in the first quarter (2.4%), supported by a surge in activity in residential construction in response to policy stimulus and state and territory governments turning the key on projects to provide support to their local economic recoveries. In the June quarter, the former surprisingly lost momentum but the latter accelerated. This comes ahead of the material disruptions in the current quarter. Unlike earlier lockdowns, the current restrictions have more directly hit the construction sector, most notably in New South Wales and Victoria. 


Private sector construction activity stalled in Q2 (0.0%) following its strong rise in the March quarter (2.7%). Engineering work firmed by 0.5% in the June quarter to consolidate its increase from Q1 (2.1%) but momentum in building work slipped to -0.2%q/q from 2.9% in the previous quarter. Driving the slowdown was residential construction as work in the segment declined by 0.2% after growth of 5.9% and 3.1% in the previous two quarters, supported by the HomeBuilder grants scheme, first home buyer incentives and rising housing prices. Both new home building (-0.1%) and alterations (-0.6%) weakened in Q2. 


We know from other data that the surge in demand for residential construction following the stimulus measures has led to supply constraints  higher materials and labour costs are indications of that  and that may have weighed on output. But while alterations have surged to record highs new home building (and residential work overall) is only back at around pre-pandemic levels.  


Work in the private non-residential segment remained weak (-0.4%q/q, -12.0%Y/Y) matching the approvals data. The headwinds associated with the pandemic have weakened demand for areas such as office and retail construction. 


In the public sector, construction activity advanced by 3.2% for the quarter after rising by 1.6%, though this was downwardly revised from 4.3% and probably boosted the former. But the key point is that momentum in public work is strengthening, rising by almost 5% over the past two quarters. Building work is driving the progress, up 9.5% over this period, compared to a 2.8% lift from engineering. This might suggest that smaller projects that can more quickly be rolled out by state and territory governments are occurring, though many states are committed to significant infrastructure projects.   


Construction Work Done — Q2 | Insights

A weaker-than-expected result for construction activity leads to what is shaping up to have been a fairly modest quarter of economic growth in Q2. The detail in residential construction was the surprise, with supply constraints perhaps explaining some of the weakness due to the very strong take-up of the stimulus measures. Disruptions in construction are likely to have been material in Q3 due to the pandemic restrictions. Beyond the short term issues, the residential cycle should resume its upturn, while public sector work will also support the economy.